Calculating provision for stakeholders on total sales

Hi Fellow Power BI Users -

I could use a bit of help on the following:

I need to calculate provision for stakeholders on the turnover of customers for each day sales were made.

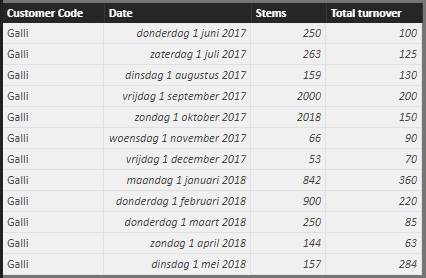
I have a fact table with sales data (i made a simplified version for this topic)
image

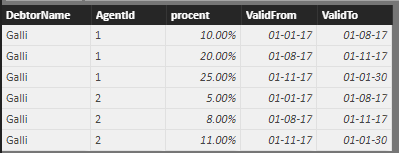
I have a table where I heve a customer name, a stakeholderId, a provision percentage and a DateFrom and DateTo. Since the percentage value may change overtime for a particlar stakeholder, I need to take this into my calculation.
image

I make use of a datetable (taken from the edna course)

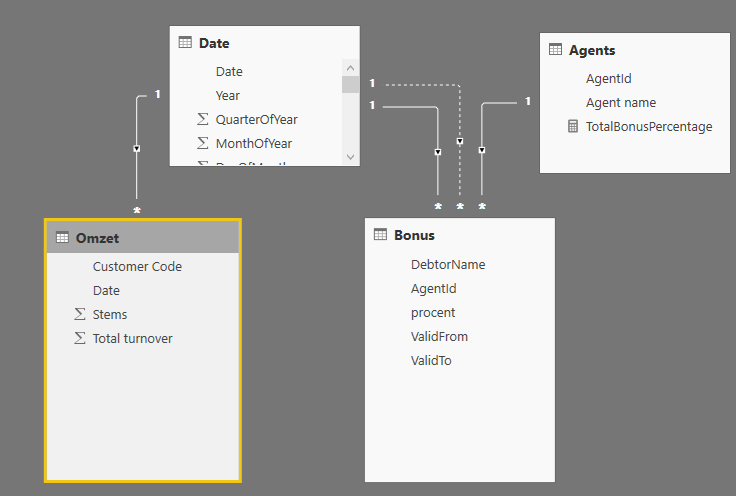
The model is set up like this

I need to retrieve a correct percentage for a sales date based on the total of percentages valid for the various stakeholders on that salesdate.

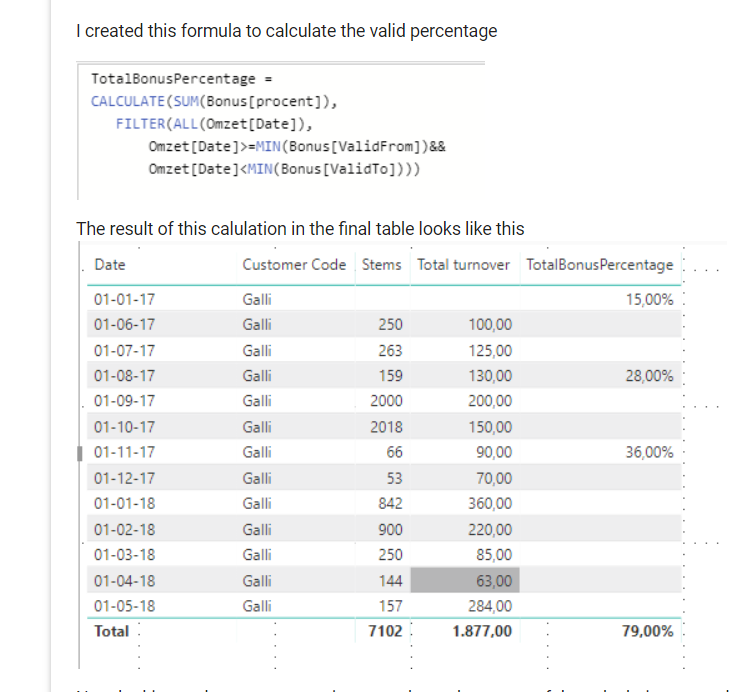
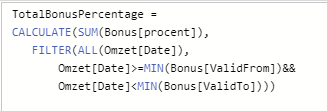
I created this formula to calculate the valid percentage

image

The result of this calulation in the final table looks like this
image

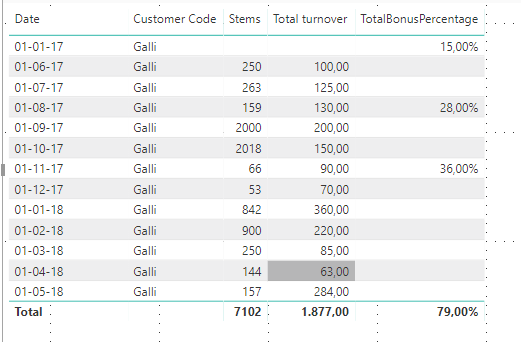
Now, looking at the percentages, it seems that at least part of the calculation went ok.

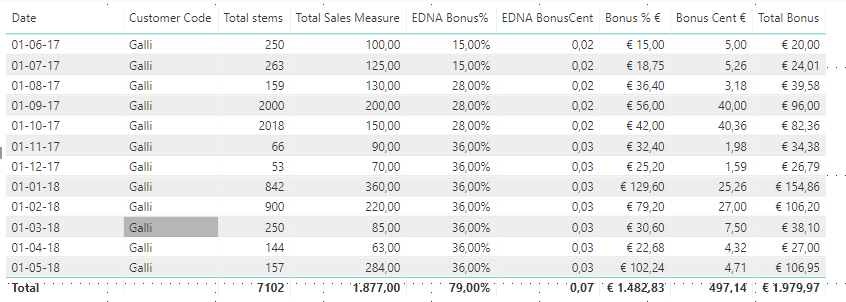
The question, how do i make it work that these percentages will be connected to the actual salesdata in the table so I can calculate the actual amount valid for that salesdate?

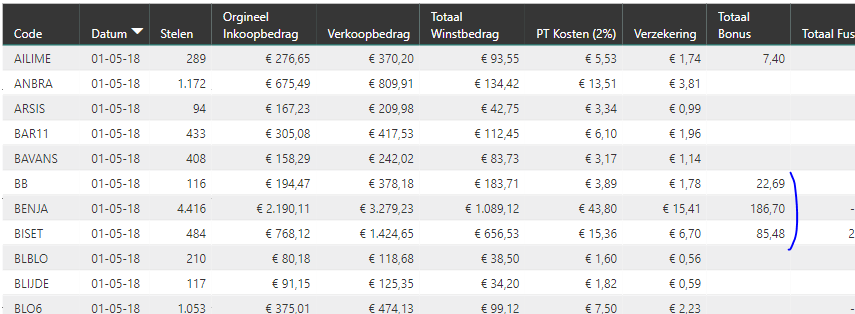
It should look something like this

Note: not every customer that produces sales is valid for provision. In case there is no agreement, the field Percentage should be blank (and the result of the calculation aswell)

I tried several options I learned for the various vid’s, but just can’t get my head around the last part.
Thanks
Juno

Interesting one, give me a day to review this and come back will a good answer for you as there’s a bit too this one that I will need to test.

Thanks for the good explanation

Thanks Sam!

Ok I think it’s this part below that needs to be optimized

I think you need to make sure you are using the date column within your measures and within the table itself to provide the right context on the calculated result.

The problem you have I think, is that you are attempting to jump from one fact table to another within the same measure which isn’t going to work.

Have you looked through this pattern called the ‘events in progress’ pattern.

You will want to use this one to allocate the correct % value through time for each agent. You can then look to use this to divide the total amounts.

Here’s an idea of the pattern below. You see that I use the date table column within it.

Sales in Progress = 
CALCULATE( SUM( 'Sales Data'[Total Revenue] ),
	FILTER( VALUES( 'Sales Data'[OrderDate] ), 'Sales Data'[OrderDate] <= MAX( Dates[Date] ) ),
	FILTER( VALUES( 'Sales Data'[Ship Date] ), 'Sales Data'[Ship Date] >= MIN( Dates[Date] )))

It’s actually a little different to yours, so definitely check out the video first to understand how to use it.

As I saw this is how you can allocate the correct percentage across dates. Then you just need to use this as your denominator in your calculation.

Can you try this and let me know how it goes. Thanks
Sam

Hi Sam,

thansk for the info.
i have been looking for this vid, have seen it before but did not remember wich one it wsa.

I will proceed and will let you know the results.

Thanks
Juno

Hi Sam,

I prepared the following formula according to the vid. As you already mentioned I had to made a few small changes.

EDNA Bonus% = 
CALCULATE(SUM(Bonus[procent]),
    FILTER(VALUES(Bonus[ValidFrom]), Bonus[ValidFrom]<= MAX('Date'[Date])),
    FILTER(VALUES(Bonus[ValidTo]), Bonus[ValidTo]>MIN('Date'[Date])))

the result

Looks great. Now just twork my way through the incorrect totals, I know you did a vid on that one too

Thanks for your help
Juno

Note I already replicated the formula in Bonus cent.

EDNA BonusCent = 
CALCULATE(SUM(Bonus[cent]),
    FILTER(VALUES(Bonus[ValidFrom]), Bonus[ValidFrom]<= MAX('Date'[Date])),
    FILTER(VALUES(Bonus[ValidTo]), Bonus[ValidTo]>MIN('Date'[Date])))

regards
juno

Which ones at the incorrect totals?

Here’s some videos on fixing totals techniques

See if these help.

Are you actually attempting to get rid of the % total. As the current ones don’t really make sense.

Maybe you should just BLANK() those, in some IF logic as sum up %s doesn’t really make a lot of sense.

Thanks for the direct links, saves me some time.

Basically any total other than the core measures (total stems &total sales) give totals that either make no sense (sum of percentage or cents ) or give totals that look like sumx.

I will work my way through the videos and update on results.

Cheers
Juno

Yes, it can be a little complicated. It’s all about understanding the context of the calculations really well.

Once this becomes like second nature it start to make a lot more sense.

Sam