Greetings! I could sure use some help with a challenge I’m having. I have spent tons of time working on this, without success. I’ve tried everything I know how to try, and must come to the conclusion that I simply don’t yet know enough to do it. It’s probably far simpler than I’m trying to make it.
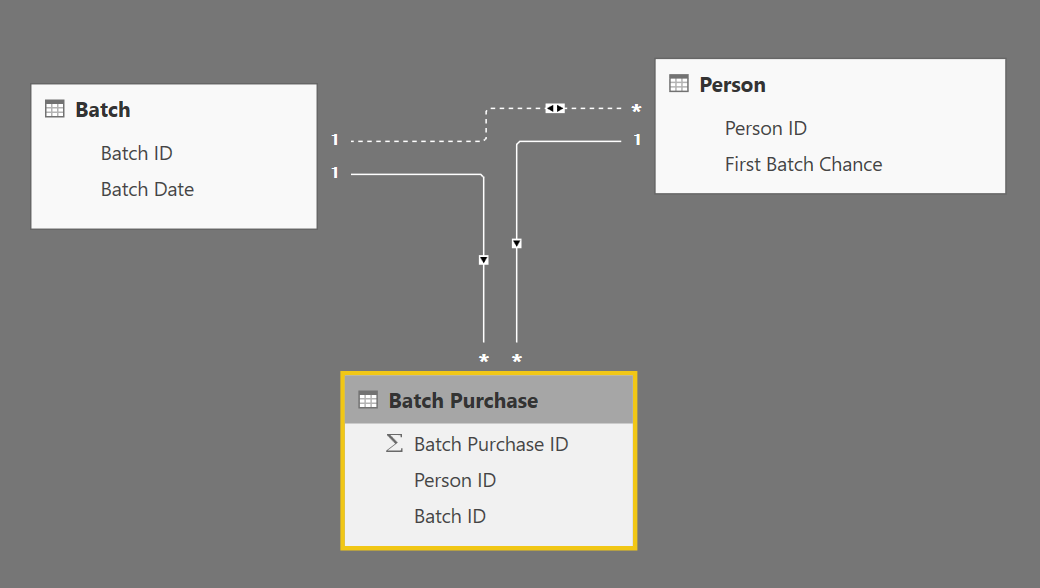
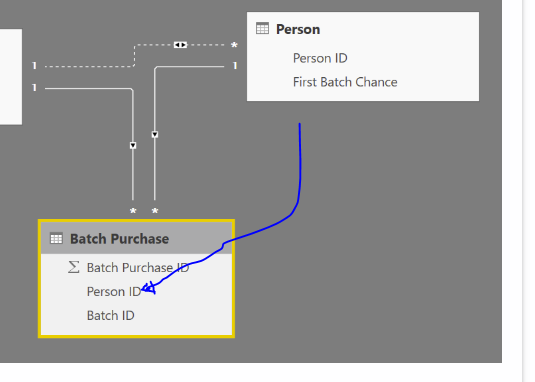
Attached is an image of the tables and relationships, with all the extraneous fields removed to keep it simple.
Some explanation:
- When people make a purchase, it goes into a batch.
- Batches are processed at certain intervals. Customers may or may not have a purchase in each batch.
- Someone can become a customer before they make a purchase as part of a batch.
- This means that a new customer may or may not make a purchase the first time they can. For example, person XYZ might become a customer on July 4, 2018, and the next batch is August 1, 2018. They may or may not have a purchase in that batch.
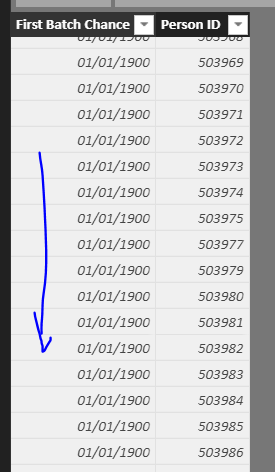
- Each person’s first opportunity to make a purchase in a batch is represented by a batch date in the person table: first batch chance.
- The range of “first batch chance” is limited to actual batch dates, which are represented in the “batch” table as “Batch Date”.
- Each time a person makes a purchase in a batch, a record is created in the “Batch Purchase” table. The entry in that table is tied to that person and the specific batch.
- Each batch can have many purchases.
So, the relationships:
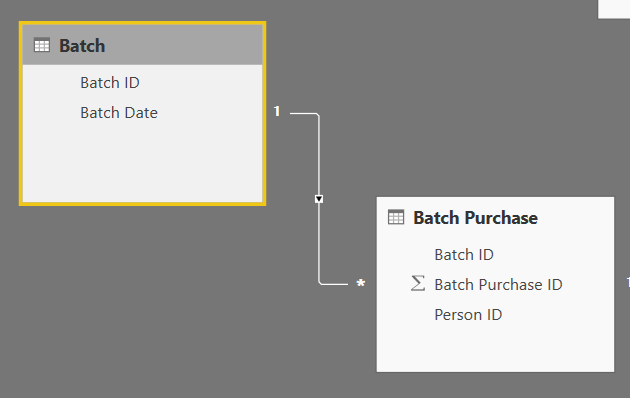
- Batch:Batch ID with Batch Purchase:Batch ID
- Person:Person ID with Batch Purchase:Person ID
- Batch:Batch Date with (INACTIVE) Person:First Batch Chance
I’m trying to find several pieces of information here, but the one I’m hung up on is as follows:
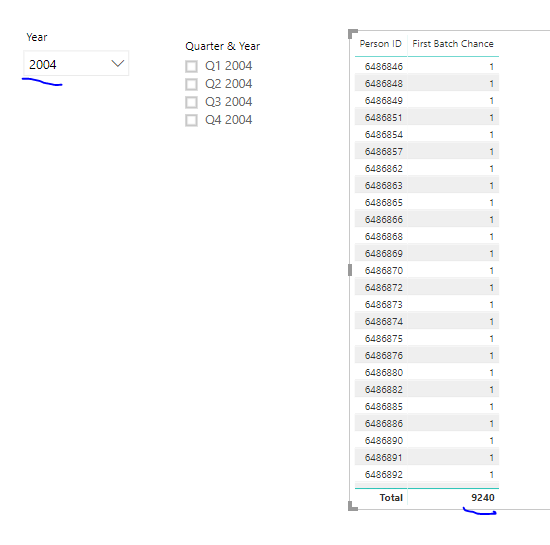
- For each batch, how many people had that as their first possible purchase date, and actually made a purchase? For example:
- For the August 1 batch, 2400 customers had that as their ‘first batch chance”.
- Of those 2400 new customers, 1300 actually had a purchase in that batch.
- Those two numbers allow me to calculate what % of new customers actually purchased in their first possible chance.
So, really, what I have been trying to build is a measure that calculates (counts) how many people actually made a purchase in their first possible batch.
I have spent a ton of time on this, and tried a hundred different things, to no avail. Any assistance anyone could provide would be greatly appreciated. If you need any more details or information, please let me know.
Thank you!
This is an interesting scenario. I’m finding it hard to imagine absolutely everything at play here.
A demo model would be helpful to play around with if this is available.
Here’s a few ideas that will hopefully help here.
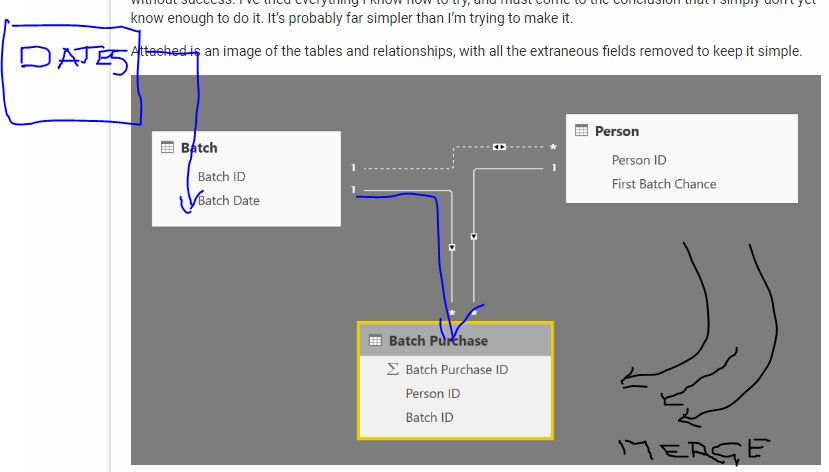
You need a date table.
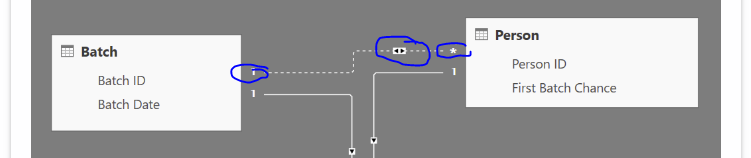
This relationship here is not a good idea
If you have any date information you want to be integrating in a date table to manage this
Also could you just merge this table into this one via the person ID. This way you would have the first batch date next to the specific person.
You could do this is the query editor.
This would also really simplify things here.
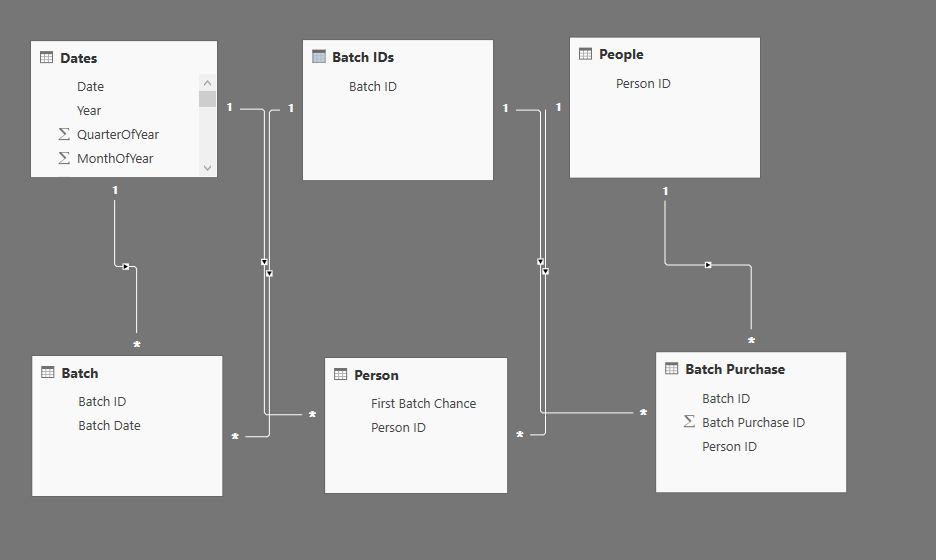
You model could potentially look like this
These are just some ideas. I’m having to guess a little bit here.
Let me know if any of these help.
Thanks
Maybe you could even merge batch into batch purchase as well.
That could simplify this model even more.
See if any of this ideas help.
Thanks for the suggestions, Sam.
I don’t think I can merge any of these tables. These tables are much simplified from the actual tables, to make thinking about it easier. Both the batch table and the person table have dozens more columns in them, which makes it impractical to merge them.
I haven’t had time to get back to this, but I hope I can upload a sample file here shortly.
Okay, I have created a small version of the database, with just samples from the complete data, which actually has millions of rows in the person and batch purchase tables.
batches sample.pbix (972.9 KB)
I’m trying to find several pieces of information here, but the one I’m hung up on is as follows:
For each batch, how many people had that as their first possible purchase date, and actually made a purchase? For example:
- For the August 1 batch, 2400 customers had that as their ‘first batch chance”.
- Of those 2400 new customers, 1300 actually had a purchase in that batch.
- Those two numbers allow me to calculate what % of new customers actually purchased in their first possible chance.
The best solution I can come up with is to create some kind of join between the person and the batch purchase, based on the First Batch Chance field–so, anyone that has an entry in the batch purchase that has a date that matches their first batch chance, then has a row in this new table. Then, we run all the calculations off of that new table.
Thanks for your help, Sam. I appreciate the training and resources you provide!
Just want to check here as I’m working through the model but have realised that there isn’t really enough data to test it because there’s a relationship here but actually no data that relates from the two tables
There only batch one
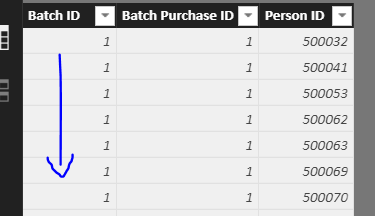
And no batch 1 here
Also not too sure if this helps much either
I’m keen to help with solution here, it looks like a good challenge but feel I’m not really looking at the right scenario data wise at the moment.
Now that I’ve seen the data here a bit closer and can image what it could look like I don’t think it will be that tough to find a solution here.
It will be just a combination of DISTINCTCOUNT, or COUNTROWS…something along these lines.
Certainly let me know if I’m missing something here.
Another thing can you advise how you want to view the results as well.
Is it by date or person or something else. The ‘context’ will really matter here as well.
Thanks
Sorry about that. When I created the sample data base, PowerBI pulled a sample that was sorted in such a way that we got the result we did. By the way, it sure is a shame that PowerBI only allows a user to export 30,000 records at a time. I certainly hope they change this in the future.
Here is an updated file. It has purchases in many batches, and also many people who have made multiple purchases. Hopefully some of those line up, and we have people making purchase on their first possible purchase date.
batches sample.pbix (952.7 KB)
Thanks, again, for your help! It is much appreciated!
Ok have spent quite a bit of time getting my head around this.
A lot of it is in the modeling challenge. Solve that and then the calculations become quite easy.
First this I noted was not date table here. This is very important to get into the model. So I did this first up.
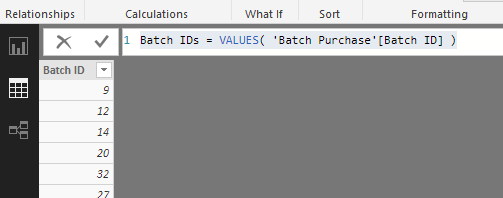
Also my feel as well you needed to create a central Batch ID column here as a lookup table.
I did the same for person IDs
See below for end model I created
Now we need to direct all filters to come from the lookup table we know have.
Here’s few ideas on formulas
First Batch Chance =
VAR CurrentBatches =  VALUES( Person[Person ID] )
VAR PriorBatches = CALCULATETABLE( VALUES( Person[Person ID] ),
                        DATESBETWEEN( Dates[Date], CALCULATE( MIN( Dates[Date] ), ALL( Dates ) ), MIN( Dates[Date] ) - 1 ) )

RETURN
COUNTROWS(
    EXCEPT( CurrentBatches, PriorBatches ) )
Total Purchases = COUNTROWS( 'Batch Purchase' )
This doesn’t return anything, so maybe data still not matching correctly.
I’ve spent a bit of time working on this one.
So I’ll hand it back to you with these major adjustments. It was all about the model on this one.
Attached
batches sample.pbix (1.2 MB)
Sam, thanks so much for your time and assistance. I appreciate it greatly. I’ll tinker with it from here.