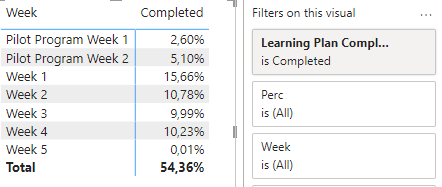
So I am trying to create a scenario where I want to go week by week and display a percentage of those who completed the compliance. Basically I get the info from the Field: Week and calculate over the total who completed that week.
For instance Column A has completed and incompleted and a total of 8859. In Column C I am looking for Week 1 for instance that has 1387 completed out of 8859. I though this formula would work but it doesn’t seem to be the case. Where am I off?
Sample Data.xlsx (169.5 KB)
Measure = CALCULATE(CountA(‘2022 Compliance Learning Plan - Graph’[Week]) IN {“Pilot Program Week 1”, “Pilot Program Week 2”, “Week 1”, “Week 2”})/COUNTA(‘2022 Compliance Learning Plan - Graph’[Learning Plan Completion Status]))