Calculating measures in different fact tables

Hello
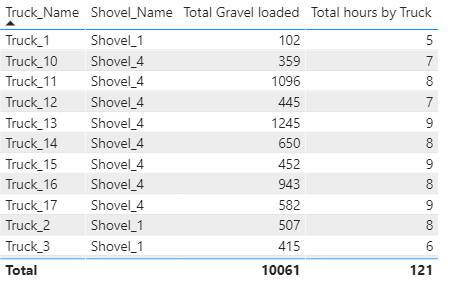
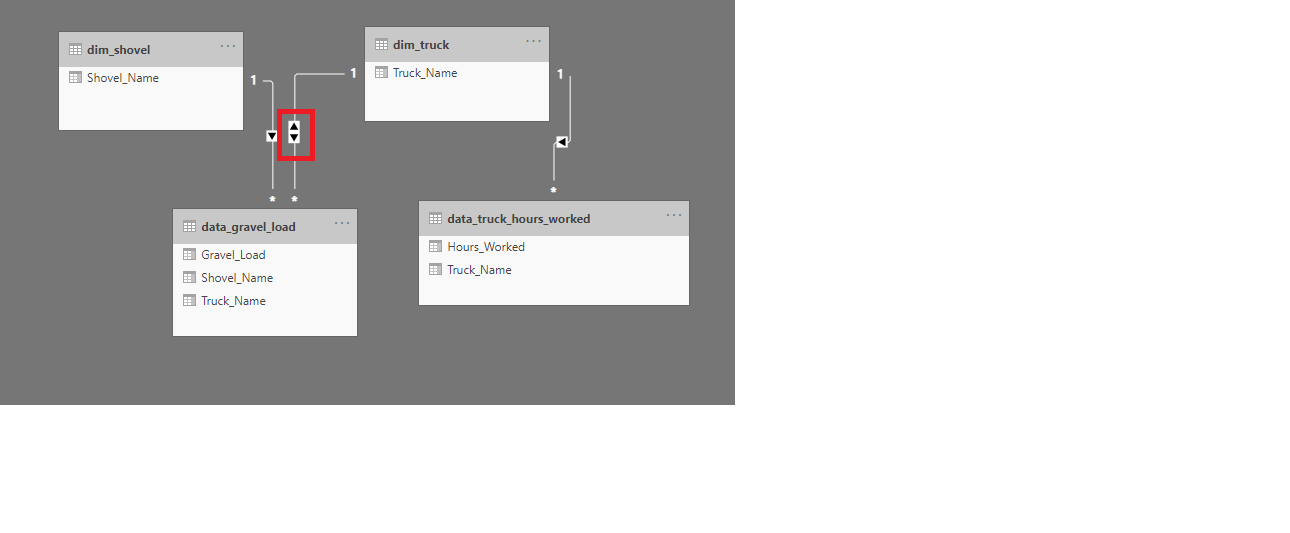
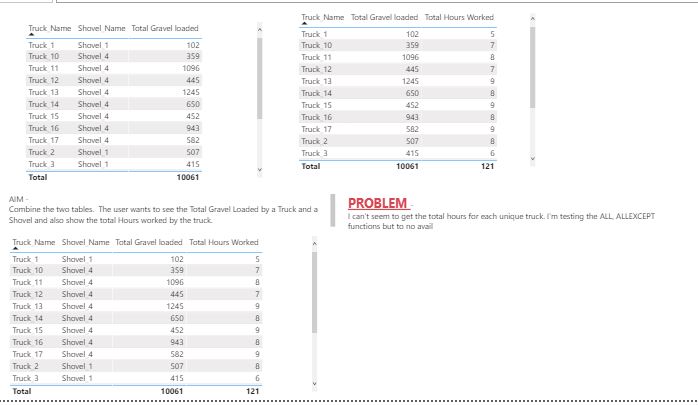
I’m having problems calculating measures in two different fact tables and displaying them in one graph table.

My PBix file is attached.

I’ve tried to use the ALL, ALLExcept functions to remove the filter on the graph but to no avail.

Any hints on possible functions to use to correctly calculate and display the data in the same table?
PS. Sorry the attached PBix file better describes problem.

data_gravel_load.csv (429 Bytes) data_truck_hours_worked.csv (229 Bytes) problem.pbix (34.3 KB)
Thank you all in advance

Hi Fiona,

You can calculate it using this measure.

Total hours by Truck = 
CALCULATE(
    [Total Hours Worked],
    CROSSFILTER( data_truck_hours_worked[Truck_Name], dim_truck[Truck_Name], Both ),
    FILTER( dim_truck, 
        [Total Gravel loaded] <> BLANK()
    )
)

with this result

image

I hope this is helpful.

1 Like

wow thank you very much @Melissa that worked perfectly! Thanks heaps again

Hi @Fiona

One more solution. Just change the cross filter direction from single to both that’s it.
Your table works fine.