Okay…I have a FACT table that has data from 4 Exhibition Shows (2 in the past 2 in the future).
Summer 2019
Summer 2020
Winter 2019
Winter 2020
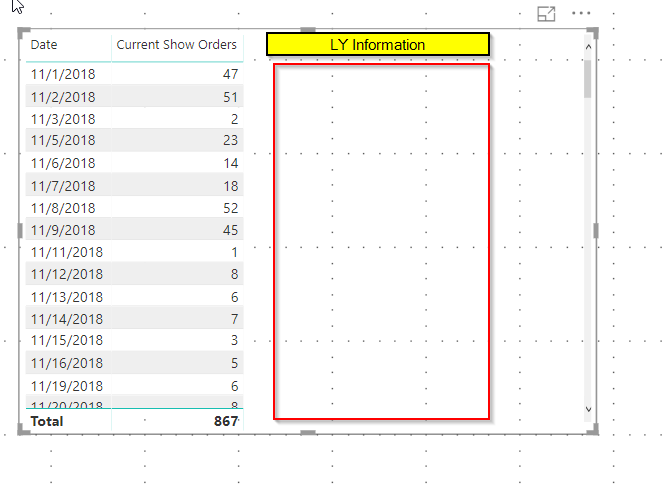
I have a slicer at the top of the report that looks at Summer or Winter data. My goal is to show on the left side of the visualization the dates when people can register for the “future” and then show a LY (sameperiodlastyear) on the column next to it.
Question…
How can you limit the dates of LY showing up in the first column while still having a LY Value?
So if my fact table - has Units (per say) and an Order Date. That fact table is joined to a date table. So I create 2 measures. Let’s assume there is data from 2019 and 2018 on this table.
Total Units = sum (Units)
LY Units = Calculate ([Total Units], samperiodlastyear(dates[date])
Now If I put the date field on the table visualization. It will start with dates in 2018. I want to start with 2019 and then see the LY value in the corresponding column next to it.
Does that make sense?
Date Units LY Units
01-01-2019 10 15
01-02-2019 20 25
I will certainly try that - It’s very interesting data model and knowing me I am setting it up wrong. I will do my best to explain. My company puts on 2 food shows a year (in NY and SF). We exhibitors that place orders. So on this table there are usually 4 different shows. 2 future show and 2 historical shows.
Winter 2020 (January) and Winter 2019 (January 2019)
Summer 2020 (June 2020) and Summer 2019 (June 2019)
Now here is where the tricky part comes in…Here are the dates when exhibitors can place those orders.
So as you can see there are overlaps on dates for Winter and Summer. What I am trying to do is put a slicer at the top of the report where the user can select Winter or Summer (not both) and then show a column of dates and have 2 measures TY Orders and LY Orders.
Does that make sense? Trying my best to explain in a message is not always easy. If there was a place that I could post the .pbix Let me know.