Ok great.
So what I always look to do it recreate as much of the table in excel within Power BI as I can. This way I can actually see the numbers and then attempt to recreate them in the next ‘context’ that you are looking to calculate them in.
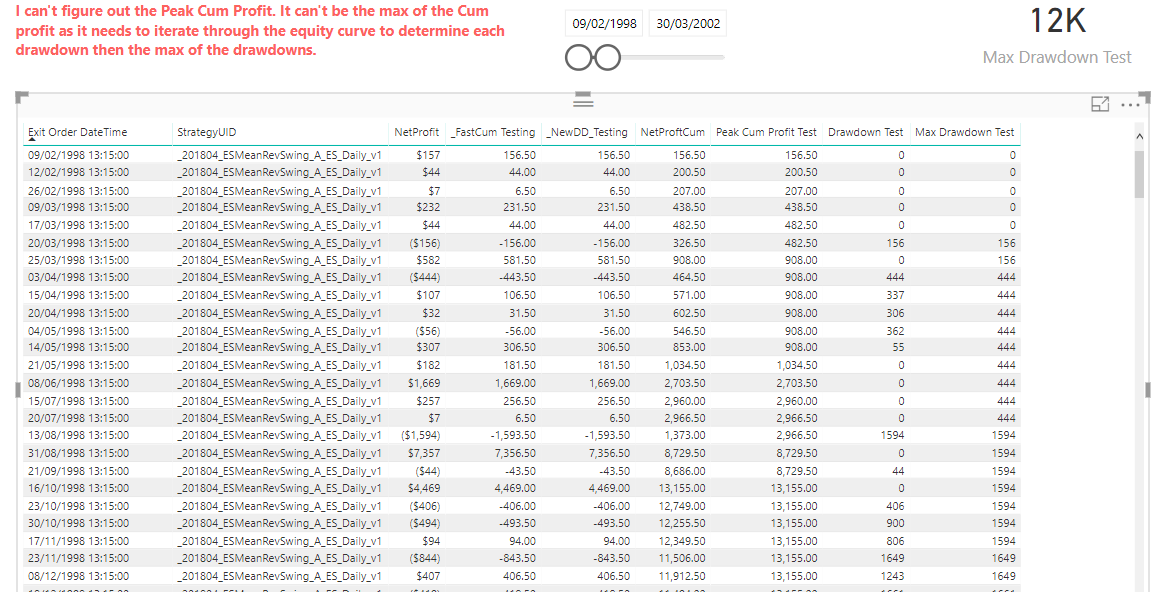
I agree the NetProfitCum looks good and is using the correct combination.
Now we have to work out Peak Cumulative Profit…this should get you what you need here in an efficient way
Peak Cum Profit Test =
VAR CurrentDate = MAX( tblTrades[ Exit Order DateTime ] )

RETURN
MAXX(
    FILTER(
        SUMMARIZE( ALLSELECTED( tblTrades ), tblTrades[ Exit Order DateTime ],
            "CumulativeProfit", [NetProftCum] ),
                tblTrades[ Exit Order DateTime ] <= CurrentDate ),
    [CumulativeProfit] )
Then from here we can get the drawdown
Drawdown Test =
IF( [NetProftCum] < [Peak Cum Profit Test], [Peak Cum Profit Test] - [NetProftCum], 0 )
Then max drawdown using a similar technique/pattern to above
Max Drawdown Test =
VAR CurrentDate = MAX( tblTrades[ Exit Order DateTime ] )

RETURN
MAXX(
    FILTER(
        SUMMARIZE( ALLSELECTED( tblTrades ), tblTrades[ Exit Order DateTime ],
            "MaxDrawdown", [Drawdown Test] ),
                tblTrades[ Exit Order DateTime ] <= CurrentDate ),
    [MaxDrawdown] )
Here’s are the answers I’m getting which seem to line up pretty close.
I had to shorter the time frame because the model performance on longer term time frames is still slow.
The model itself overall is running very slow. This may not be preferred but my advice is to start in a brand new model here and copy over all these new formulas. What happens sometimes I find when you have had historic formula that have taken a huge amount of time to calculate, they have a lasting impact on your model. In my view this is definitely the case here, as the model still have quite poor calculation times and my laptop is slowing right down which is never a good sign. I’m presuming you’re having the same problems.
This calculation here on the whole are not intensive, so this is just my recommendation.