Calculating/Dividing Two Pivot Tables

I am using excel to create pivot tables and than divide the tableIs to get desired outcome. See: https://drive.google.com/file/d/1jL4vNdBxAi0LPigy3iaQ-iGFzHiMPaBA/view?usp=sharing and https://drive.google.com/file/d/1dwPDuuOju7nbLyDVa5njvLObCqviJa3Z/view?usp=sharing

These questions: https://drive.google.com/file/d/1dwPDuuOju7nbLyDVa5njvLObCqviJa3Z/view?usp=sharing

i am answering in Excel currently. I would like to answer them in Powerbi. Please assist?

SQL i am using in Powerbi, to pull in the desired tables:

App Filter Categories

select a.label as ‘App Category’
, b.label as ‘Menu’
, c.product_uid as ‘Product UID’
from app_menu_filters a
left join app_menu_filters b on b.parent_uid=a.uid
left join app_menu_filter_products c on b.uid=c.app_menu_filter_uid
where a.status=‘A’ and a.level=1
order by 1,2,3;

Sales and Product Data

SELECT date(o.created_datetime) as Date, od.product_uid as ‘Product UID’,
p.manufacturer Manufacturer, p.bmc BMC, p.brand Brand, od.label as SKUs, p.selling_unit as ‘Unit of Measure’,
ROUND(if(od.amended_quantity is not null, od.amended_quantity, od.quantity)) as ‘Units Sold’,
ROUND((if(od.amended_quantity IS NOT NULL, od.amended_quantity, od.quantity))*p.content,2) as ‘Sales Volume’,
ROUND((if(od.amended_quantity is not null, od.amended_quantity, od.quantity))*od.price,2) as ‘Sales Value’
FROM order_detail od
left join order o on od.order_uid=o.uid
left join product p on od.product_uid=p.uid
where o.status in (‘D’,1,2,3,4,5)
and not od.label =‘Plastic Bag’
and date(o.created_datetime) >= ‘2020-04-01’

Please see data in access: https://drive.google.com/file/d/1zqSbAvESHf5WUw4U-OKXjL_9E8NbJTfd/view?usp=sharing

Please see data in excel: https://drive.google.com/drive/folders/1jUFHVlGZsHNdE6H0TuB2FI6c19Up52eR?usp=sharing

Hi Anthony,

Welcome!

Unsure about your full query (and your familiarty with Power BI compared to excel) but some pointers here.

  1. You can divide columns in Power BI by using the function: DIVIDE()
  2. Make sure that the tables are mapped in Power BI (i.e. a relationship is drawn) so that the report can find the relation between the two columns.
  3. Functions for rounding are also avilable.

I would encourage you to make a first version of a Power BI and whenever you are stuck on a specific part, we will be happy to help!

Kind regards

Thank you for the feedback. I cant seem to get the columns as described in the SQL query above? Here is the Powerbi file: https://drive.google.com/file/d/1HCoYlPrhBQKuvWb-TpOBbDBEnv0BV0Sj/view?usp=sharing

Hi Anthony,

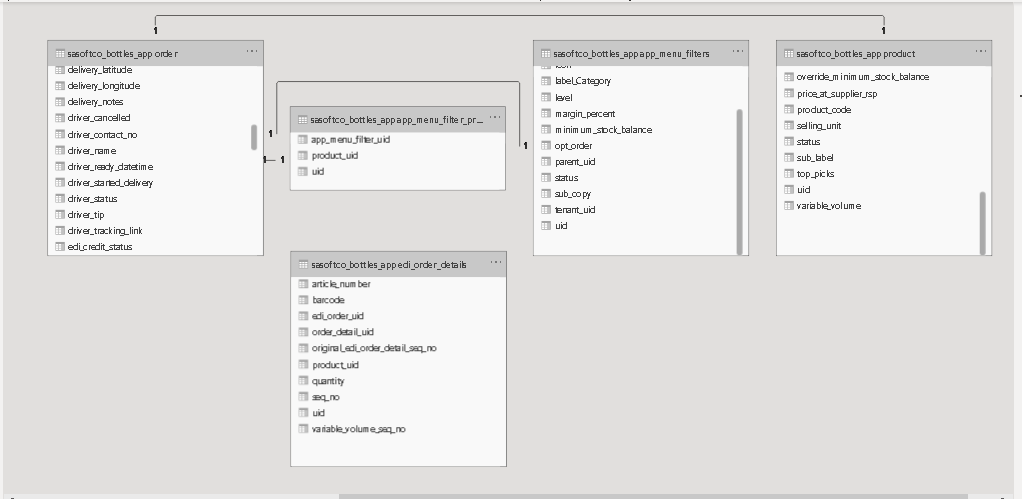
It looks to me like you skipped the data modelling part in Power BI.

In Power BI you need to draw the relationships between your tables:

  1. You did not draw a relationship between order details and the other tables. This is why you see the the number 6.935.266 for all of your data.
  2. The other relationships are all based on uid. I doubt that this is the intended relationship? If those relationships were created by Power BI, delete them and make the correct relationships between the tables.

This video from Sam should give you some extra info:

Kind regards,
Rens

Is this wrong, automatically created in powerbi?

Hi @Yrstruly, we noticed that your inquiry was left unsolved for quite some time now. We strive to answer ALL inquiries in the forum.

However, if you are sure that you provided all pertinent context to your concerns and read how to use the forum more effectively and still find your question unanswered, you can check out tutorials to learn this yourself as your membership also comes with relevant resources that may help you with your Power BI education.

While our users and experts do as much as reasonable to help you with your inquiries, not all concerns can be attended to especially if there are some learnings to be done. Thank you!