Hi all,
I have a huge dataset of survey scores for each team, department and directorate within my organisation. We run the same survey every year, and each team, department, directorate etc will receive a number of scores for different survey questions and themes. I’ll be focusing on the theme scores in this question. I know it should be simple, but I cannot work out how to write a measure that will calculate the difference between scores each year, by theme and team/department/directorate.
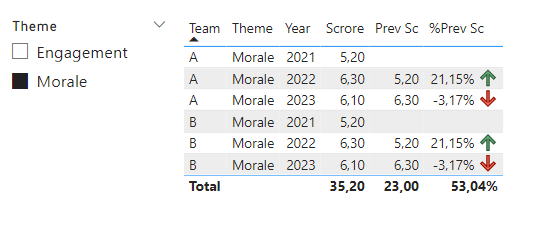
Unable to properly paste a table, but columns would be survey year, team name, theme code, theme name, score (out of 10), for example -
|2021|Team A|M1|Morale|5.2|
|2022|Team A|M1|Morale|6.3|
|2023|Team A|M1|Morale|6.1|
|2021|Team B|M1|Morale|5.2|
|2022|Team B|M1|Morale|6.3|
|2023|Team B|M1|Morale|6.1|
|2021|Team A|E1|Engagement|7.7|
|2022|Team A|E1|Engagement|7.8|
|2023|Team A|E1|Engagement|8|
|2021|Team B|E1|Engagement|5.4|
|2022|Team B|E1|Engagement|5.3|
|2023|Team B|E1|Engagement|5.7|
I simply want to be able to calculate Team A Morale Score change between 2022 and 2023 for example.
I know this should be easy, so really appreciate any help! All of the examples I have found seem to deal with a calculation of sales figures for the year, whereas I’m looking at one specific score and comparing the change year on year!