Hi Fellow Power BI Users -
I’m Interested in the fantastic Show Case (Cohort analysis Introduction), I have the following questions regarding it
Q-1
How can we calculate the retention rate of the customer for a specific period e.g. (Year or Month)? Is it required in the business world?
Q-2 I need some summary spot on the Scenario event report inside the Cohort analysis what is the story talk about?
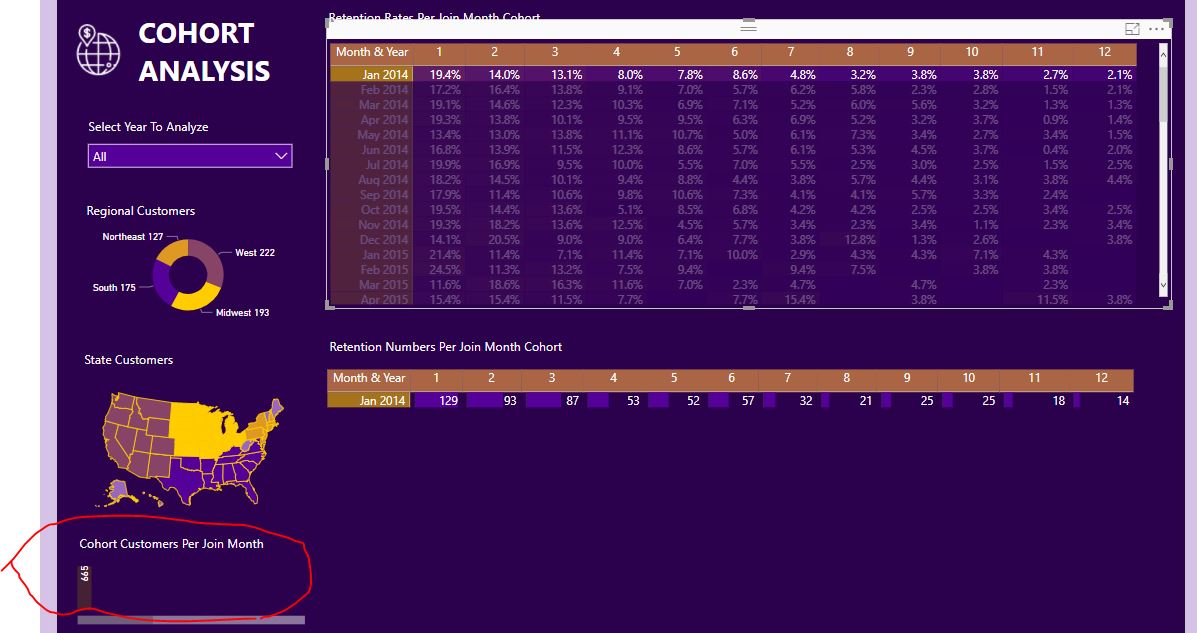
Q-3 Please refer to the Red Circle On the Bottom left of the Image Below
As I Understand the number is the total customers who joined the cohort on Jan 2014 (Clear)
But When I click on the Cohort (Feb 2014) I found 2 Numbers on the same postition (Bottom Left)
Jan 2014 = 123 (???)
Feb 2014) = 530 (Clear means the number of customers Joined the cohort)
Based On My Assumption It should be
Jan 2014 = 665 (Customers start on the Cohort)
I need to understand where the Number 123 came from?
Thank you
Please send over a copy of the PBIX to help better assist in answering your question.
Thanks
Jarrett

It is from the same resource Inside EDNA .
Cohort analysis Introduction
Same pbix file for “Cohort analysis Introduction”
Okay, thought you had recreated yourself and ran into an issue. I will have a look at the PBIX and get back to you.
We may need Sam to get exact # here. If you take the 123 and divide by the original # of 665 you get 18.5%, and the table says 19.4% for period one. I think there could be an issue in the calculation of the measure for Retention %.
Thanks
Jarrett
Thank you so much looking forward to hear from Sam.
Hi Sam did you get this issue?
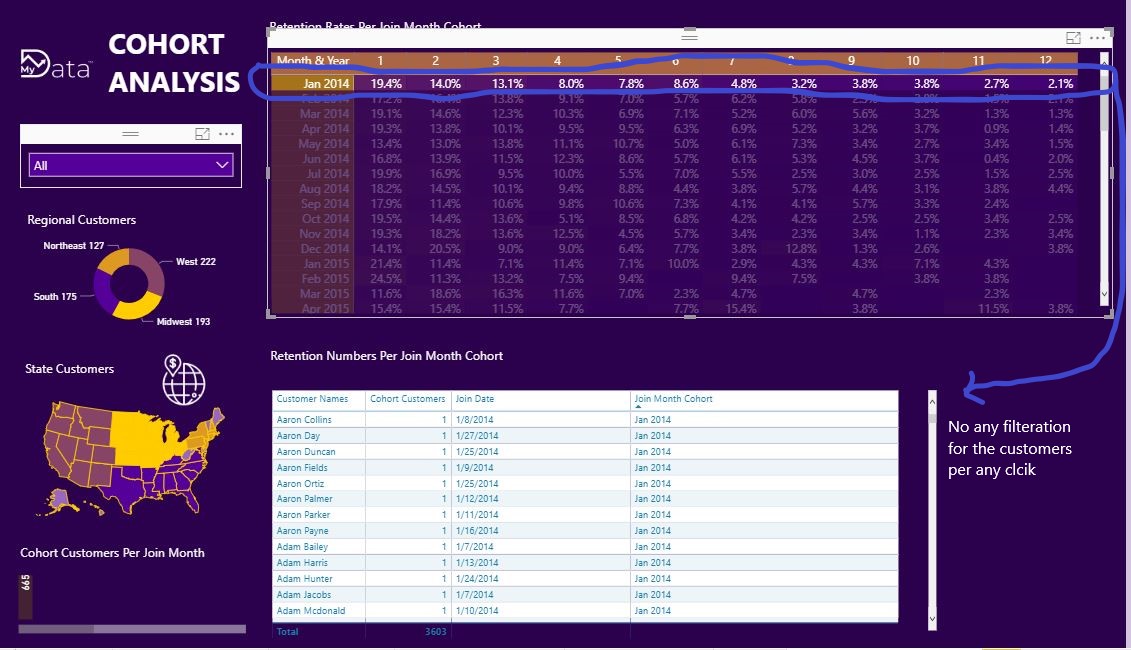
Just to remind again about the case (long time no answer) from another angel Please look at the attached screen-shot:
As I Understand the total customers who joined the cohort on Jan 2014 (Clear) = 665 customers
But When I click on the Cohort line the total number of customers = 606 customers distributed over the months of the cohort (129,93,87,…etc) and the total number of the cohort in the bottom left of the screen is = 665 the cohort total on the line of the matrix on the top of the screen should be = 665, not 606, if we subtract 665-606 = 59 where the resulting number has gone?
Thank you
You have to think what the cohort is calculating. It’s calculating customer first purchase and then when they purchase again. That’s the logic that’s in behind this as described in the session below
See below
So the remaining amount is the group of customers who did purchase in that cohort (Jan 2014) but haven’t purchased since then
Thank you so much I understand the concept but I think it should be added to the first group of customers who purchase in the first month (1) for the 2014 cohort I mean it would be 59+129 = 188 , I’m not sure if you agree with me or not that the total number of customers in the 12 months should be equal to the Whole customers of the cohort, Is that right or not?
what is support my hypothesis is the percentage calculation distributed between each month in the cohort = 19.4+14.0+…+2.1= 91.3 % and should be 100% , I need your comment about this hypothesis and your logic interpretation if you did not agree with it. I believe the logic that the cohort monthly submission should be equal to the total cohort.
Thank you
No I don’t agree as that’s not what the calculation is doing.
There are customers that didn’t make a second purchase in the 12 months, that’s why they are not included here in the matrix for the 12 periods.
It’s as simple as that.
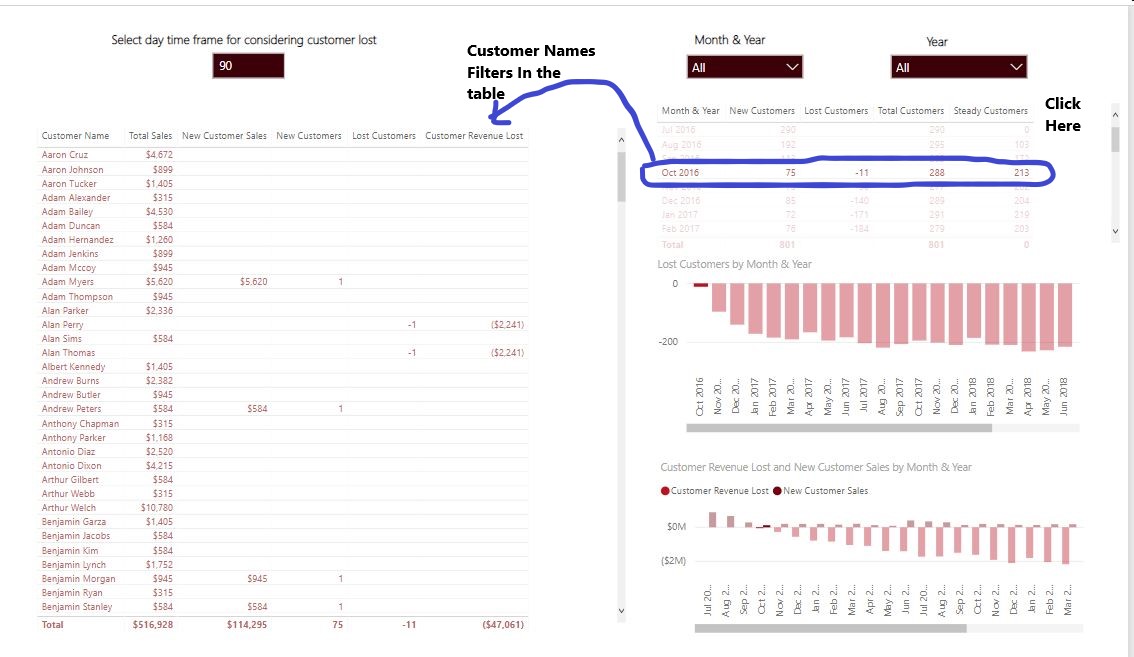
I tried to do tracing for the customer’s names by clicking on the cohorts in any different periods (who ordered x number of times but not return back) or the one who still continue ordering till the end of a cohort, there is no any customer filtering based on my click:
You did something impressive before in defining (New and lost customers) when you click on any cohorts it gives detail on the state of the customers
I’m doing a project using the same concept in Enterprise DNA, I get to benefit from your cohort but my client needs the names of those customers who ordered and didn’t return, he (the client) need it to contact his customers to know why they didn’t come back, please advise.
I have another Question, Sam, How do we calculate the churn rate at the end of each cohort by creating a new column at the rightmost position of the (Cohort Analysis) report table?
Thank you