I’m trying to calculate cumulative sales and compare it to cumulative sales last quarter. My cumulative sales measure is working, however when I plug that measure into the cumulative sales LQ, and use date add to change the context to last quarter, it is not adding up properly.
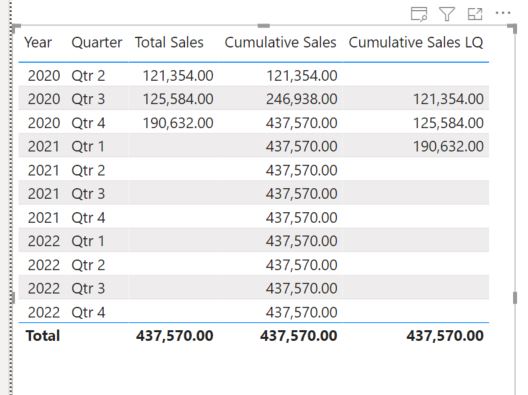
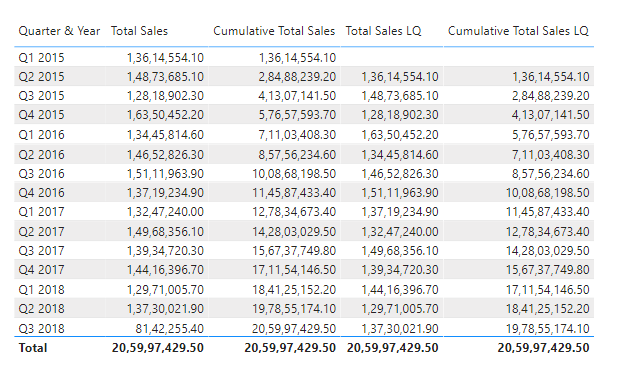
Here is a snapshot of how these measures are displaying on a table:
My cumulative sales LQ measure is simply spitting out total sales from last quarter, but it is not taking a cumulative total. I’m not sure why this is happening, since I’m measure branching with the working cumulative sales measure.
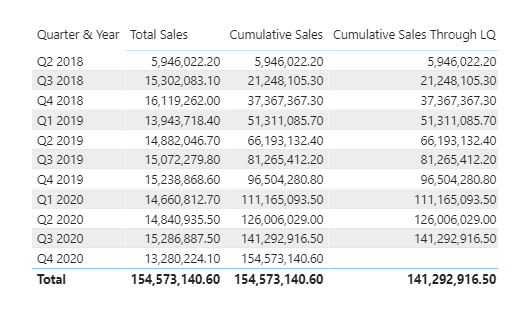
Your measure is actually doing exactly what it’s being asked to, which is to return the total cumulative sales for the last quarter. I think instead what you want is to return cumulative sales for all selected dates through the last quarter :
Give this a go:
Cumulative Sales Through LQ =

VAR CurrentQ =
CALCULATE(
    MAX( Dates[Quarter & Year] ),
    Dates[Date] = TODAY()
)

VAR Result =
CALCULATE(
    [Cumulative Sales],
    Dates[Quarter & Year] < CurrentQ
)

RETURN
Result
I hope this is helpful. Full solution file attached below.
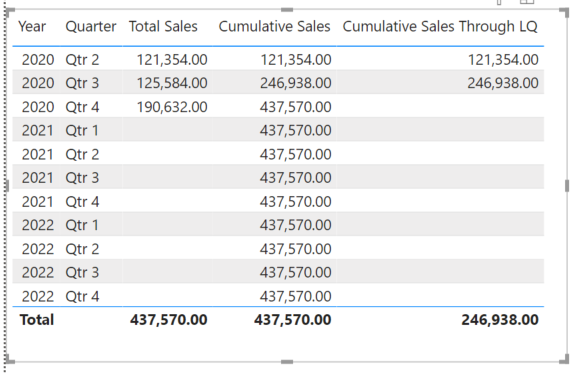
However, the new measure is now producing the same result as the cumulative sales measure, except it stops at the prior quarter. This makes sense given your dax, however I need to build some kind of dateadd into it, so it calculates the cumulative sales from one quarter prior. What do you think?
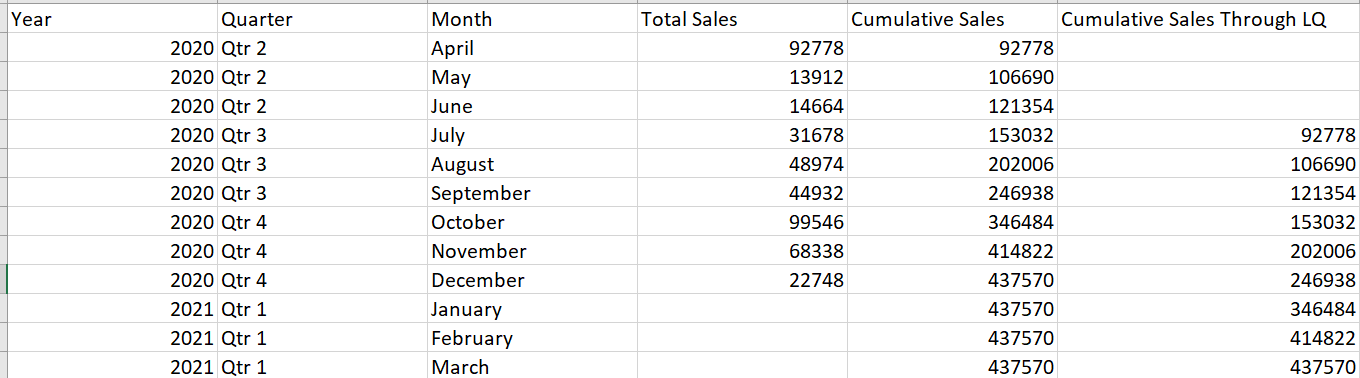
Sorry if I’m being dense here , but I’m not understanding what you’re after. If you could please provide a mockup of the results you want to see, that would be a big help.
Sorry - got tied up in a string of meetings before I could finalize and send you a solution, but looks like @Harsh has got you well covered (thanks, Harsh!).
Hi @pete.langlois, we aim to consistently improve the topics being posted on the forum to help you in getting a strong solution faster. While waiting for a response, here are some tips so you can get the most out of the forum and other Enterprise DNA resources.
Use the forum search to discover if your query has been asked before by another member.
When posting a topic with formula make sure that it is correctly formatted to preformatted text </>.
Use the proper category that best describes your topic
Provide as much context to a question as possible.
Include the masked demo pbix file, images of the entire scenario you are dealing with, screenshot of the data model, details of how you want to visualize a result, and any other supporting links and details.
Hi @pete.langlois, did the response provided by the experts help you solve your query? If not, how far did you get and what kind of help you need further? If yes, kindly mark the thread as solved. Thanks!