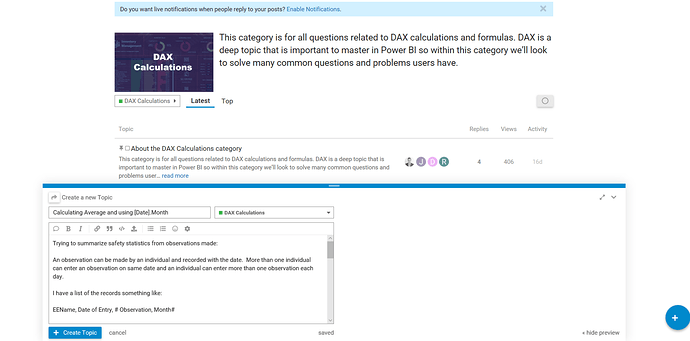
Trying to summarize safety statistics from observations made:
An observation can be made by an individual and recorded with the date. More than one individual can enter an observation on same date and an individual can enter more than one observation each day.
I have a list of the records something like:
EEName, Date of Entry, # Observation, Month#
Observation is always 1 as there is an entry for each record
I want to determine the average over a period of time.
I created a Date table spanning 1/1/2018 to 12/31/2019 and linked them by Date of Entry to Date in table.
I then want to have a table or chart with EE name and then the total observations as well as average observations per EE and each month as well as each year
I have used this:
Avg per DATE = SUM(Data[# Observations])/DISTINCTCOUNT('Date'[Date])
as well as
Avg per DATEday = SUM(Data[# Observations])/DISTINCTCOUNT('Date'[date].[Day])
First seems like total observations over complete time period in date table per EE
Second is confusing
Also can do ,
Avg per DATEmonth = SUM(Data[# Observations])/DISTINCTCOUNT('Date'[Month])

Avg per DATEyear = SUM(Data[# Observations])/DISTINCTCOUNT('Date'[Date].[Year])
what are the *.[Month] or *.[Day] doing differently?
Also when in a table ADDS THE AVERAGES
How can I find out averages for months submitted not over time period and what’s the difference with the *.[ ] parameters.
Pasting an excel table below. weird pipe character. How do you load a table?
|EE|Month#|# Observations|Date of Entry|


