Not sure if this was discussed previously. I hope someone can help me.
I have a few measures that calculate something like Total energy before the intervention, Total energy Post-intervention,…
We are comparing 25 years so I want to create a table/matrix where the measures are listed in the rows and want to show the values by year where the years are column values. So swopping the table around.
something like this: 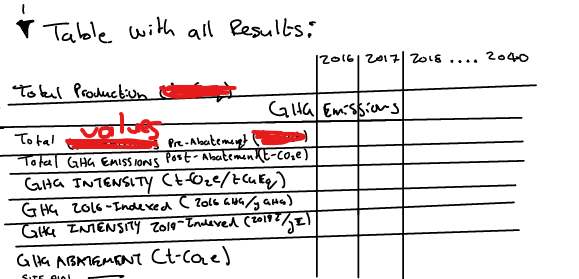
How can this be done? Should I do something like your financial reporting and embedding of templates?
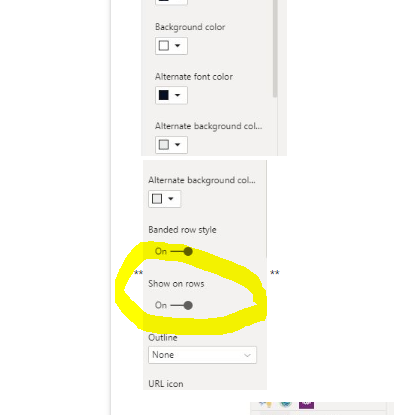
Have you tried this
just go into the Format tab of the matrix and turn on option “Show on Rows”. this will display Measures as rows instead of columns…
1 Like
Thanks. This would have saved me hours