Hello, I have a 2.5M row table of pay records. Each employee can have multiple pay records for each pay date. I would like to create a table that has a single record for each employee on each payday but includes all other columns in the table. I am currently doing this in Power Query by first creating a new column that concatenates employee ID and pay date (EID_PAY), then referencing the original table and removing duplicates values in the EID_PAY column, but I am sure there is a more efficient way to do it in DAX.
The way I do it now I end up bringing a lot of extra data into my model that I don’t really need, as it’s all contained in the original pay table and I just need a way to dynamically filter out duplicates in the EID_PAY column so I can do some math on other attributes (age at date of pay, for example).
Any help would be appreciated.
Are you able to ‘pivot’ the relevant columns to get to create this table?
This to me sounds like you just need to do the opposite of unpivoting really, because the data is already long and thin and you want to take it to a pivoted format.
Then you could delete any additional column that aren’t required. This would likely get to the table shape you need.
You definitely want to sort this out in the query editor.
If this isn’t what you need can you provide some image examples to help get this right answer.
Chrs
Sam
Here are a few screenshots of what I’m working with.
Here is part of the pay records table:
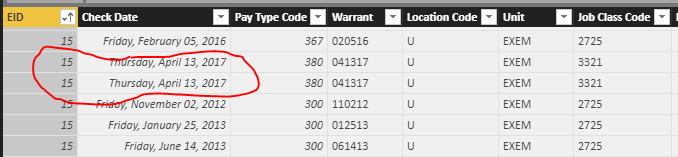
You can see that EID #15 has two pay records for April 13, 2017. I want to retain all the data in this table, because i’m going to need every record for calculating total pay, for example, but there are e demographic characteristics I want to analyze where I need just one record per employee per paycheck, but with the relevant demographic data still included.
I created a column “EID_Paydate” to serve as a unique identifier. Now I want to calculate a table that simply removes all the duplicates from the “EID_Paydate” but retains the other columns (if there’s a way to choose which columns to keep, that will work, but I can also take them all). I have achieved this in the query editor by referencing the original table and then filtering as described, but it seems to really slow down the whole model. I was hoping a calculated table would’t impact performance as much.
Really i’m just looking for a Dax function or pattern that can create a filtered version of a table. Is there a simple example of this that I could perhaps adapt?
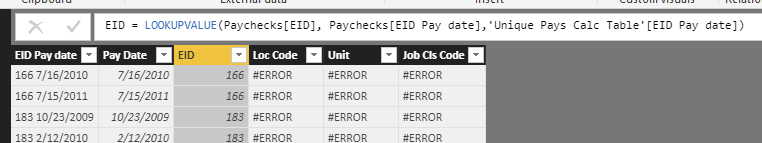
I tried using VALUES to create a new base table and then LOOKUPVALUE to read in the needed information, but i’m getting errors on any text field. You can see that EID worked:
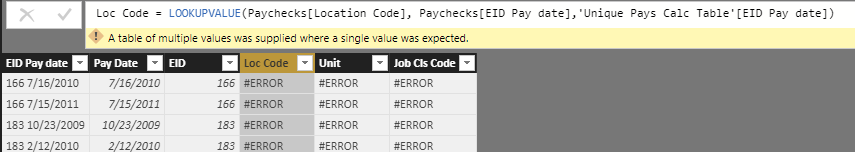
But Loc Code, Unit, and Job Cls all failed, even though it’s exactly the same formula:
OK, lots there, help with any of these issues would be great. Thanks!
Ok cool, I think what you’re looking for here is the SUMMARIZE function.
This function does almost exactly what you’re after, where it can produce a summary table which removes duplicates.
What I would do it create a new table with a few column in it.
For example
SUMMARIZE( Paycheck table, EID Column, Pay Date Column…etc )
The columns you select here will create that simple summary table you’re after and remove duplicates where you need. You just need to get the right columns in here.
Once you setup this table I would then utilise calculated columns to bring the rest of your data in.
I wouldn’t try to get too fancy around the calculated table function. Keep it simple with the SUMMARIZE and then add onto the table with calculated columns which maybe require a little more logic.
Chrs