CALCULATE SUM based on TopN

Hi PowerBi Friends,

I have a table with TopN based on two different tables and I used crossjoin function to get its rank.
Now, I would like to combine/add things together that have the same entity/name.

As you can see here on the snapshot, I have the same group name but lies on a different TopN group and I wanted to combine or add this together so that it will be on its rightful TopN. Attached is my pbix file and the measures that I used. Appreciated your time doings this. Thanks!

        Jihwan Invoice Total by Group = 
SUMX (
KEEPFILTERS (
    FILTER (
    ALLSELECTED(FactFinalisedInvoicesDetailed[Invoice Type] ),
        COUNTROWS (
            FILTER (
                'Customer Rank',
                [Jihwan Rank by Invoice Type] >= 'Customer Rank'[Min Rank]
                    && [Jihwan Rank by Invoice Type] <= 'Customer Rank'[Max Rank]
            )
        ) > 0
    )
),
[Total Invoice]

)

This is the RANKX measure. I used crossjoin to rank on two different tables.

Jihwan Rank by Invoice Type = 
    RANKX(CROSSJOIN(ALL(FactFinalisedInvoicesDetailed[Invoice Type]) ,ALL(GroupedFinalisedInvoices[Group Owner]) ), [Total Invoice], , DESC)

Hello @ronald_balza,

Thank You for posting your query onto the Forum.

Firstly, the formulas that you’ve provided onto the post as well as the scenario that you’ve highlighted was observed nowhere into the file.

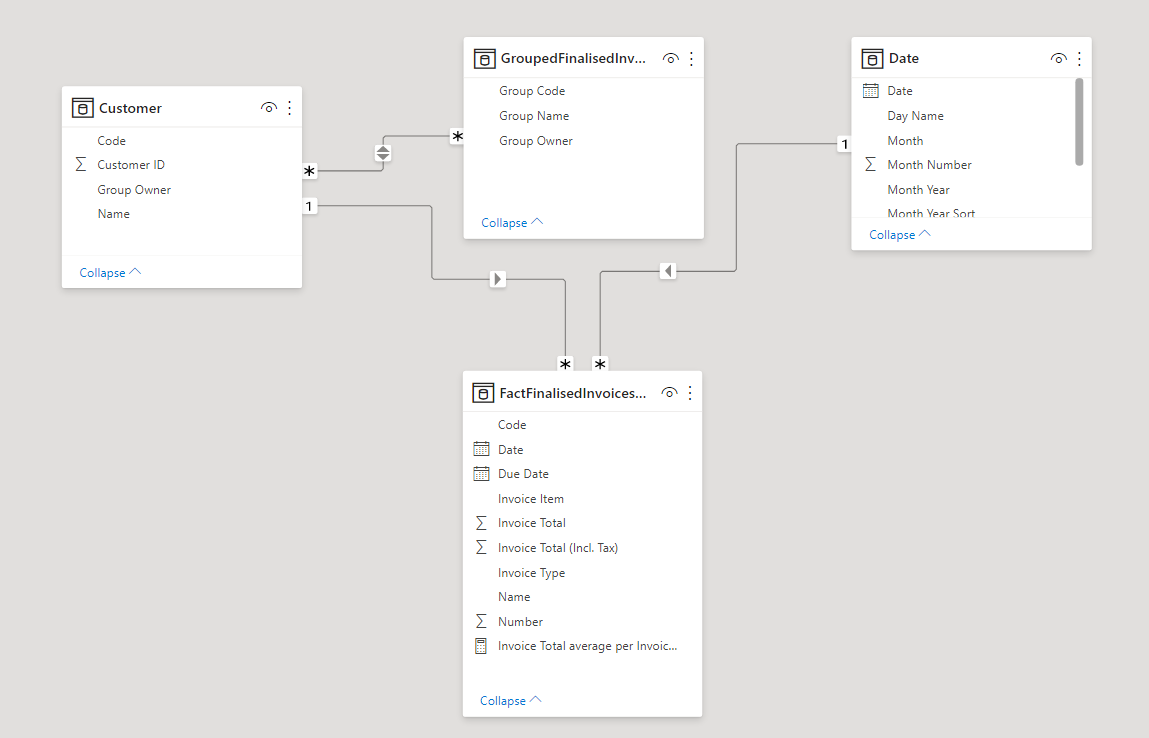
Apart from that, coming to the solution now, you had created “Many-to-Many” bi-directional relationship into the model and that too between the Dimension tables i.e. between “Customer” table and “GropedFinalisedInvoices” table. Below is the screenshot provided for the reference -

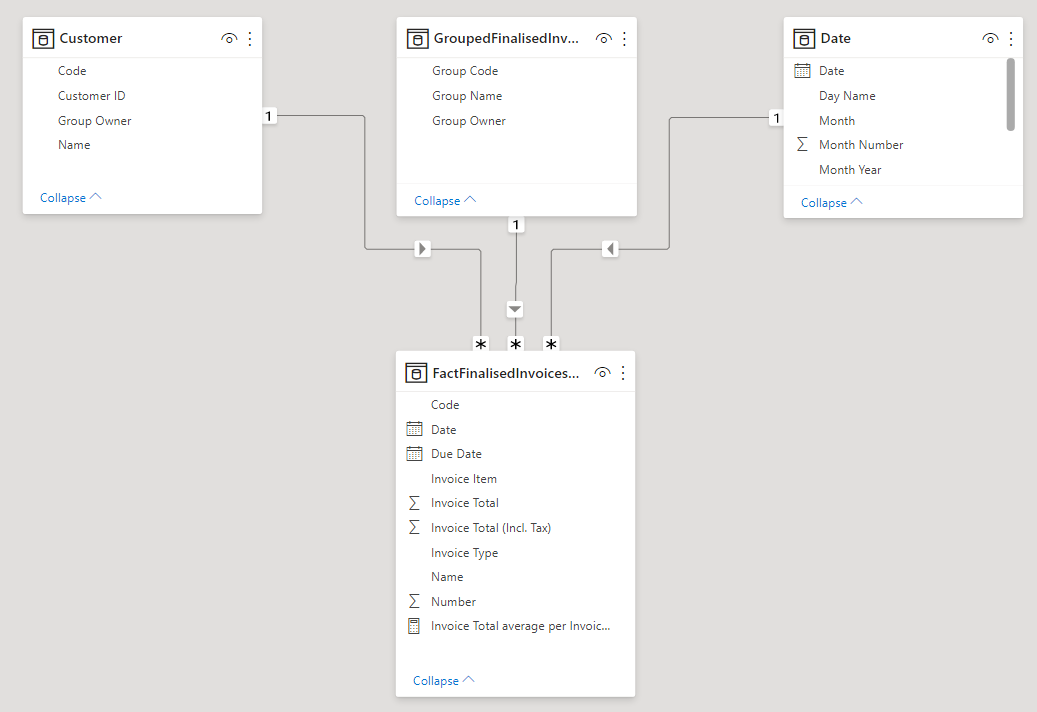
Rather I created a relationship “One-to-Many” relationship between the Fact and Dimension Tables i.e. between “FactFinalisedInvoicesDetailed” table and “GropedFinalisedInvoices” table based on the Code field which is common between the two tables. Below is the screenshot provided of the revised relationship of the data model -

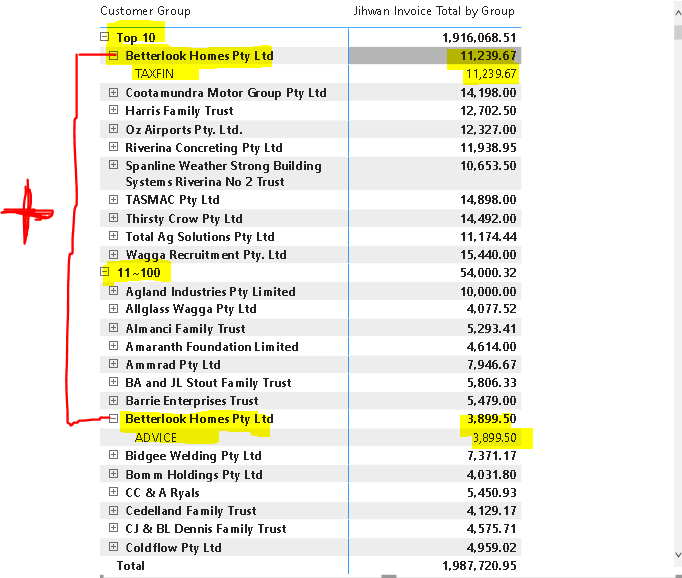
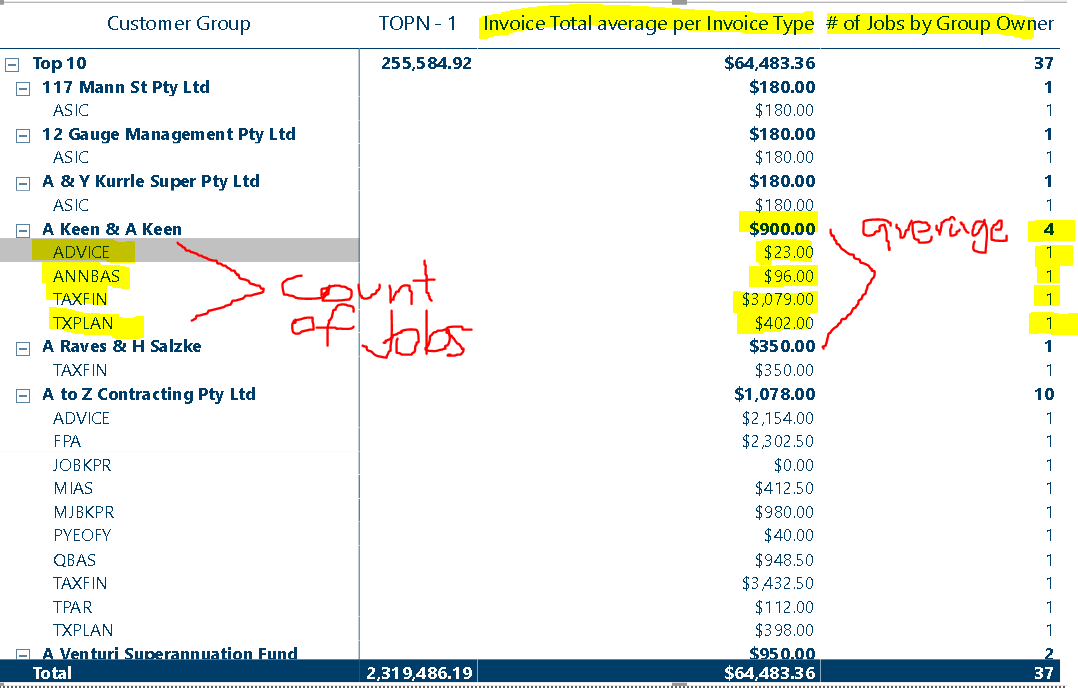
Also it’s observed that you’re dragging “Group Owner” field from the Dimension Table and “Invoice Type” from the Fact Table in order to create a hierarchy. My question is - “How can data from the Fact Table flow up to the Dimension Table?”

So now, since you’re trying to create a hierarchial grouping based on Ranking technique and evaulate the “Total Invoices” results based on that. This technique is complex to achieve -

Firstly, you’ll be required to break ties since there’re multiple invoices with the same amount. So to break the ties below is the formula provided for the reference -

Alphabetical Rank - Owner = 
VAR _Current_Owner = SELECTEDVALUE( FactFinalisedInvoicesDetailed[Name] )

VAR _Result = 
COUNTROWS(
    FILTER( ALL( FactFinalisedInvoicesDetailed[Name] ) , 
        FactFinalisedInvoicesDetailed[Name] <= _Current_Owner ) )

RETURN
_Result

Once you break the ties, you’ll be required to calculate the ranking by adding the context of the “Invoice Type” within the Ranking measure since your next hierarchy after the “Group Owner” is “Invoice Type”. Below is the formula of the ranking provided for the reference -

Ranking - Owner = 
VAR _Ranking = 
CALCULATE(
    RANKX( 
        ALL( FactFinalisedInvoicesDetailed[Name] ) , 
        [Total Invoice] + DIVIDE( [Alphabetical Rank - Owner] , 100 ) ,
        , 
        DESC ) , 
    ALLSELECTED( FactFinalisedInvoicesDetailed[Invoice Type] ) )

RETURN
IF( ISBLANK( [Total Invoice] ) , 
    BLANK() ,
    _Ranking )

And now, once the ties are broken and context of the hierarchy is added into the Ranking Technique than you’ll be able to group them using the “Grouping and Segmentation Technique”. Below is the formula provided for the reference -

TOPN - 1 = 
VAR _TOPN = 
CALCULATE( [Total Invoice] ,
    FILTER( VALUES( FactFinalisedInvoicesDetailed[Name] ) , 
        COUNTROWS(
            FILTER( 'Customer Rank' , 
                [Ranking - Owner] >= 'Customer Rank'[Min Rank] &&
                [Ranking - Owner] <= 'Customer Rank'[Max Rank] ) ) > 0 ) )

RETURN
IF( ISBLANK( [Total Invoice] ) , 
    BLANK() , 
    _TOPN )

Now, what you did was firstly, you didn’t broke the ties than you creating the ranking directly by “Invoice Type” which is incorrect. Because your Invoice Type is the secondary hierarchy, the first hierarchy is set for “Group Owner”. So without considering the context of the “Group Owner” hierarchy you went directly for the “Invoice Type” and lastly you created a grouping formula by considering the “Invoice Type” again whereas it should’ve been “Group Owner”. Below is the formula provided which you’ve written -

Total Invoice By Rank Group = 
SUMX(
    KEEPFILTERS(
        FILTER(
            ALLSELECTED( FactFinalisedInvoicesDetailed[Invoice Type] ), 
            COUNTROWS(
                FILTER(
                    'Customer Rank',
                    [Rank by Invoice Type] >= 'Customer Rank'[Min Rank] &&
                    [Rank by Invoice Type] <= 'Customer Rank'[Max Rank] )
            ) > 0
        )
    ), [Total Invoice]
)

Rather since you want to use this pattern of formula i.e. SUMX rather than CALCULATE than the formula will be like this (Note: But first you’ll have to create the previous formulas like I’ve mentioned. Don’t use this formula directly) -

TOPN - 2 = 
VAR _TOPN = 
SUMX(
    FILTER( VALUES( FactFinalisedInvoicesDetailed[Name] ) , 
        COUNTROWS(
            FILTER( 'Customer Rank' , 
                [Ranking - Owner] >= 'Customer Rank'[Min Rank] &&
                [Ranking - Owner] <= 'Customer Rank'[Max Rank] ) ) > 0 ) , [Total Invoice] )

RETURN
IF( ISBLANK( [Total Invoice] ) , 
    BLANK() , 
    _TOPN )

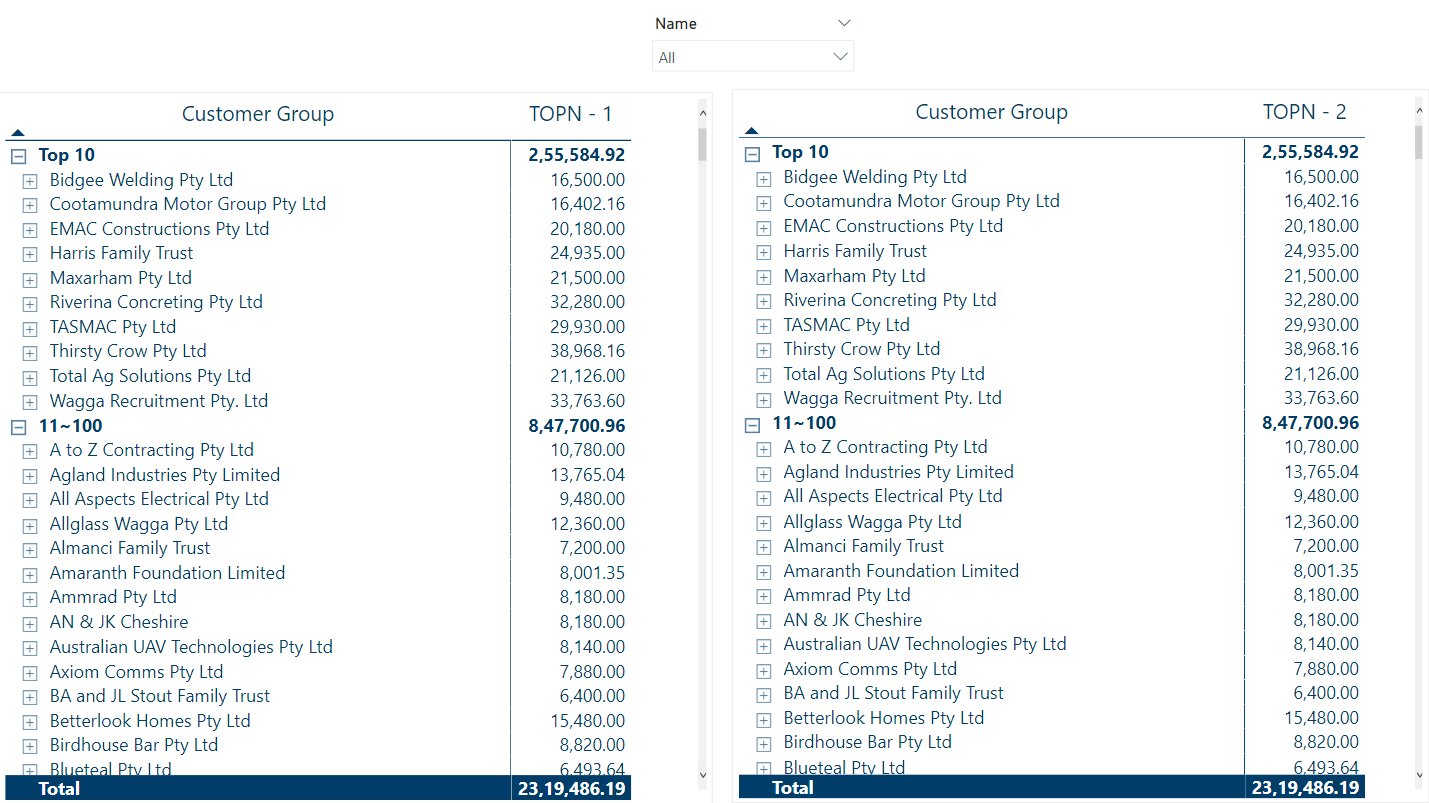
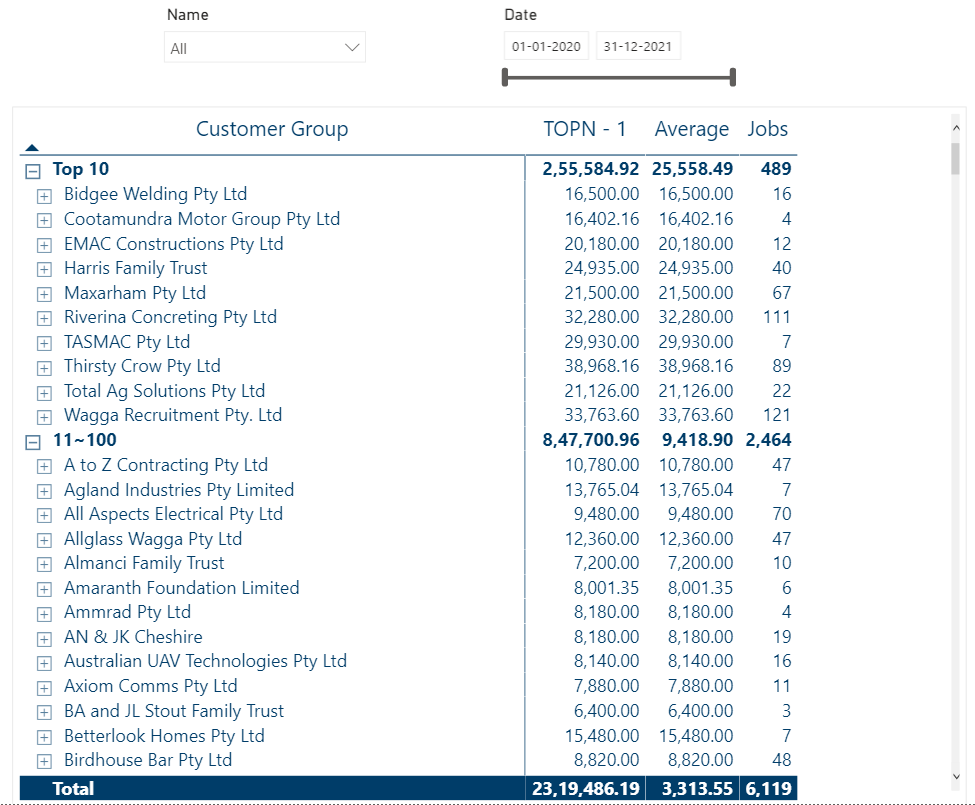
Now, see the results. Below is the screenshot of the final output provided for the reference -

Lastly, if you see the totals of your results and compare it with mine. You’ll observe that your formula considered the range of Group Owner even after 700 whereas my formula will stop at the range of 700.

I’m also attaching the working of the PBIX file for the reference. And if you want to cross-verify my results you can go to the “Cross-Verification” worksheet for that as well.

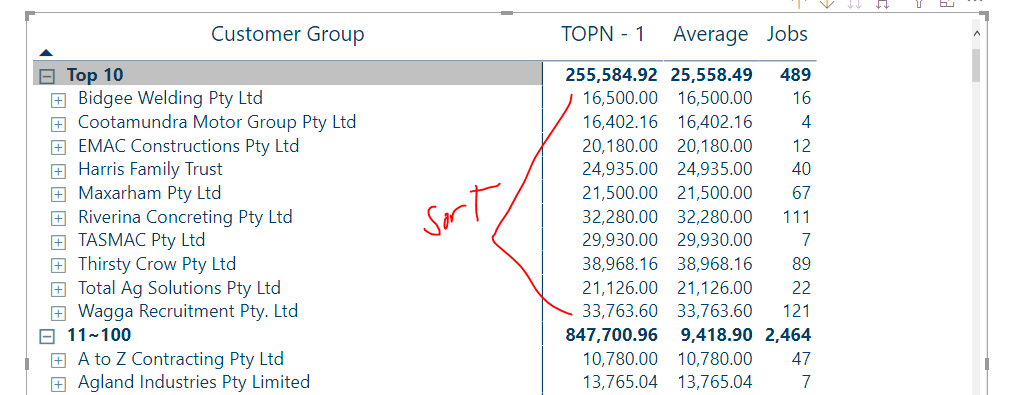
Important Note: The sorting is possible either for the Grouping or for the Numbers. Both are not possible at the same time.

Hoping you find this useful and meets your requirements that you’ve been looking for. :slightly_smiling_face:

Thanks and Warm Regards,
Harsh

Hierarchial Grouping Ranking - Harsh.pbix (376.0 KB)

5 Likes

Hi @Harsh ,

I very much appreciated on what you have done on the solution, it’s very detailed, very informative. Will take note of all your advice.

With that being said, this leads me to another concern which is the total average of the invoice and the count of jobs being displayed. The calculation seems to be on point however when I include them, the topN is being disregarded (if that makes sense).

Once again, thanks for your time and effort in doing this. Do you have some sort of a tutorial on the web so that I can subscribe to it? Cheers!

Count of Jobs Measure

# of Jobs by Group Owner = 
SUMX(
SUMMARIZE(
    FactFinalisedInvoicesDetailed , 
    FactFinalisedInvoicesDetailed[Invoice Type] ,
    "@Jobs" , 
    [Rank by Invoice Type] ) ,
[@Jobs] 

)

Average of Invoice

Invoice Total average per Invoice Type =

AVERAGEX( VALUES('FactFinalisedInvoicesDetailed'[Invoice Type]),
CALCULATE(SUM('FactFinalisedInvoicesDetailed'[Invoice Total])))

Hello @ronald_balza,

You’re Welcome. :slightly_smiling_face:

I’m glad that I was able to assist and guide you.

So, the reason you got these types of results for the “Jobs” and “Average” metrics is because the contexts are totally different. The context that we’re referring in the table visual is of “Grouping and Segmentation” technique so the formula/measure also needs to be as per that context. Now, what happened in your case was you wrote simple formulas which would workout in simple scenarios but here the scenario is different i.e. it’s a “Grouping” scenario so measure needs to be writtten accordingly.

So since we’ve already done the hard-work of breaking ties and figuring out the ranks of each owners. Now, it’s time for smart work. We’ll build our measures for “Jobs” as well as “Average” based on the formulas that we’ve already built. So below is the measure for “Jobs” as well as for “Average” provided for the reference -

Jobs = 
VAR _TOPN = 
CALCULATE( COUNTROWS( FactFinalisedInvoicesDetailed ) ,
    FILTER( VALUES( FactFinalisedInvoicesDetailed[Name] ) , 
        COUNTROWS(
            FILTER( 'Customer Rank' , 
                [Ranking - Owner] >= 'Customer Rank'[Min Rank] &&
                [Ranking - Owner] <= 'Customer Rank'[Max Rank] ) ) > 0 ) )

RETURN
IF( ISBLANK( [Total Invoice] ) , 
    BLANK() , 
    _TOPN )


Average = 
VAR _TOPN = 
AVERAGEX(
    FILTER( VALUES( FactFinalisedInvoicesDetailed[Name] ) , 
        COUNTROWS(
            FILTER( 'Customer Rank' , 
                [Ranking - Owner] >= 'Customer Rank'[Min Rank] &&
                [Ranking - Owner] <= 'Customer Rank'[Max Rank] ) 
            ) > 
        0 ) , 
    [Total Invoice] )

RETURN
IF( ISBLANK( [Total Invoice] ) , 
    BLANK() , 
    _TOPN )

Lastly, for average I’m seeing the same results as actuals so I’m not sure how you want the results for Average to be. But again, just remember whatever the logic is, just convert them into the “Grouping” scenario and you’ll get the results the way you want.

I’m providing below the screenshot of the results for the “Jobs” as well as “Average”. And again you can cross-verify the results by going through the “Cross-Verification” worksheets for the same.

I’m also attaching the working of the PBIX file for the reference.

Lastly, before I sign off from this thread I also noticed that you were using the DAX for Date table rather I would sincerely recommend you to use the M Code for creating the Date table. Our expert @Melissa has already created the codes and are available under the M Code Showcase which is ideal and compact which one could have in their data model. Below is the link of the M Code Showcase provided for the reference as well.

Do you have some sort of a tutorial on the web so that I can subscribe to it?

Well, the answer for the above question is - “No, I as of now, I don’t have any tutorial videos over the YouTube :slightly_smiling_face:. But do subscribe the Enterprise DNA YouTube channel where lot’s and lot’s of great content is provided by Sam Sir as well as by our other members of the experts team on a day-to-day basis. And I’m sure you would not like to miss out on this.”

Hoping you find this useful and meets your requirements that you’ve been looking for. :slightly_smiling_face:

Thanks and Warm Regards,
Harsh

Hierarchial Grouping Ranking - Harsh v2.pbix (369.6 KB)

2 Likes

Hi @Harsh,

Thank you very much for all the things you do here. Really appreciated it. Yeah I am subscribing and as I progress, I 'll contribute something here on this awesome community, same as you do.

1 Like

@Harsh

You can’t sort this do you? Or the thing that you said, it can’t be sorted two at a time.

Hello @ronald_balza,

You’re Welcome. :slightly_smiling_face:

I’m glad that you found the solutions helpful.

You can’t sort this do you? Or the thing that you said, it can’t be sorted two at a time.

No, as suggested earlier. Not possible to sort two things at the same time. It provides the results but the only thing is not in a chronological order or from higher to lower.

Lastly, I’m really happy to see that you want to make the contributions to the Community which is absolutely great thing. The best way to learn is by sharing and helping others.

I really look forward to seeing your posts in the Community.

Thanks and Warm Regards,
Harsh

1 Like