Hi all,
I know the answer to this question is probably very “obvious and silly” to everyone but I’ve been trying to apply Dax into my reports and the deeper I go the more confused I become. I tried searching for how to create a simple “percent Complete” for tasks on several projects but I cant seem to get it right. I need to calculate how much of the project has been done based Start and End dates with current date as a mid point…
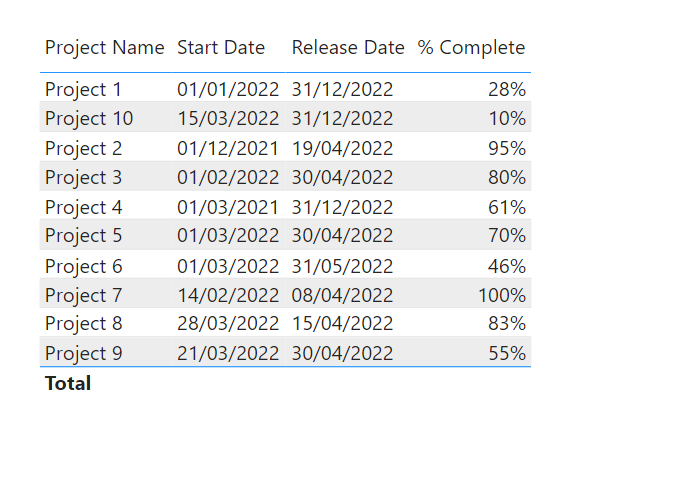
Ex: Project 1 = Start Date 01/01/22 End Date 01/10/22 Today’s Date 01/05/22 % Complete 50%
I’ve attached an example bpix with sample entries based on my data. I based this off Sam’s “Project Management
Project Management Sample.pbix (182.8 KB)
Project Management Sample.xlsx (12.4 KB)
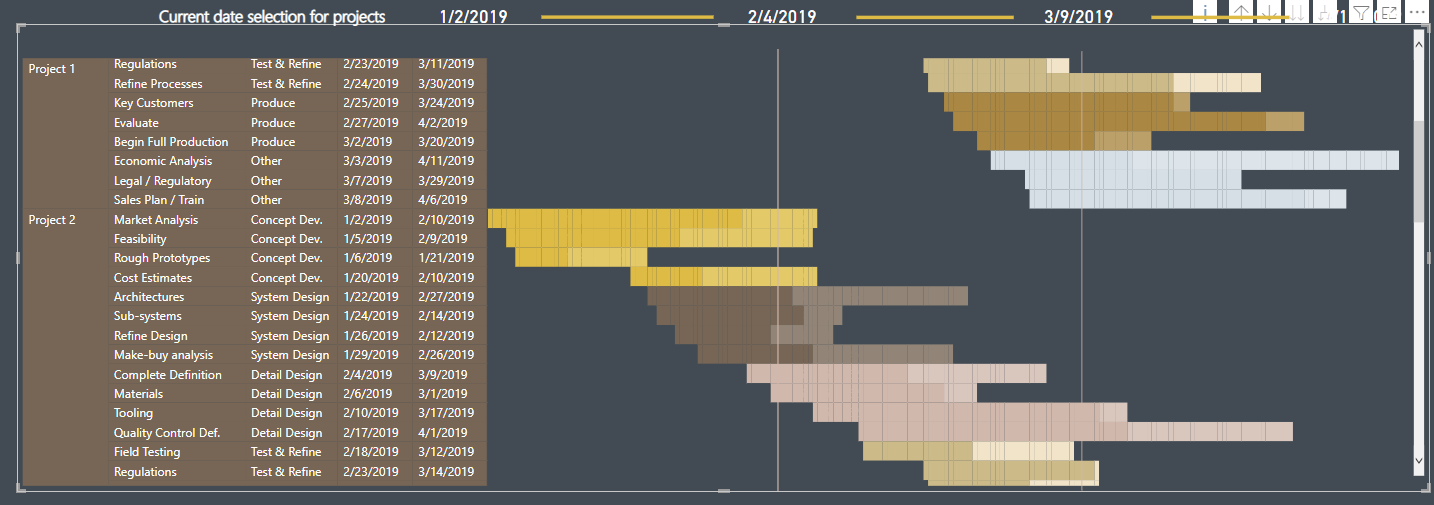
Insights” report and am trying to replicate the Gantt chart he created. More specifically… the ‘Within Days’ Measure which calls for the %Completed field.
This is what I am trying to recreate:
Again, sorry for the newbie question. Whenever I try to create something based on what I’ve seen in this community, I realize I know nothing at all. But I’m determined to get there one day .
Thanks for the help