Calculate % of tickets resolved on time

Hello,

Can I please get some help with creating a Dax measure for the below:

  1. Count the values of column 2 in Table 2 (true or false column)
  2. Compare columns 1 from Tables 1 & 2 (incident key reference)
  3. Provided column 3 in Table 1 meets certain criteria (resolved or closed)
  4. Based on criteria in column 3 of Table 2. (type of SLA, contains the word resolution)
  5. And column 4 of Table 2 is not set to pause or cancelled

Table 1 is Incident

Table 2 is SLA

I need to compare the incident number and task number from both tables, if they are equal & the state column in the incident table is set to resolved or closed.

I need to then count the has breached column in the SLA table, if the value is false, provided the SLA definition has the word resolution in it, and the stage column in the SLA table is not set to pause or cancelled.

The closed resolution SLA is either

  • Desk P1 resolution
  • Desk P2 resolution
  • Desk P3 resolution
  • Desk P4 resolution

sample data and pbix file attached
incident.xlsx (88.8 KB)
sampledata.pbix (62.1 KB)

Grateful for any help.
Thanks

Hello @seunao,

Thank You for posting your query onto the Forum.

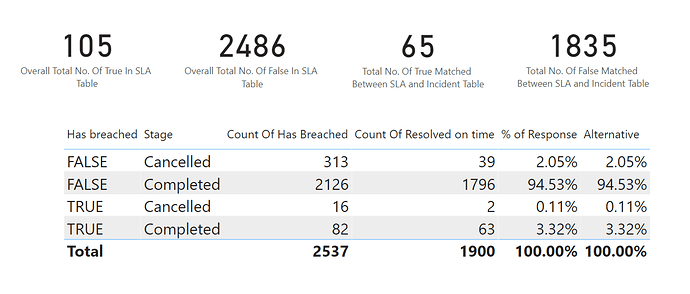
I am trying to get a measure based on the incident table that compares the incident number with the task table, and then counts the true or false column of the SLA table to determine what percentage made SLA.

Try this two basic formulas to achieve the results -

Count Of Resolved on time = 
CALCULATE( COUNTROWS( SLA ) ,
    FILTER( SLA ,
        SLA[Task] = RELATED( Incident[Number] ) ) )


% of Response = 
DIVIDE( 
    [Count Of Resolved on time] , 
    CALCULATE( [Count Of Resolved on time] , ALLSELECTED( SLA ) ) ,
    0 )

Or, if you’re just looking for % of Responses than the Actual numbers then here’s consolidated formula -

Alternative = 
VAR _Count_Of_Resolved_On_Time = 
CALCULATE( COUNTROWS( SLA ) ,
    FILTER( SLA ,
        SLA[Task] = RELATED( Incident[Number] ) ) )

VAR _Count_Of_All_Resolved_On_Time = 
CALCULATE(
    CALCULATE( COUNTROWS( SLA ) ,
        FILTER( SLA ,
            SLA[Task] = RELATED( Incident[Number] ) ) ) , 
    ALLSELECTED( SLA ) )

VAR _Percentage_Of_True_or_False = 
DIVIDE( 
    _Count_Of_Resolved_On_Time , 
    _Count_Of_All_Resolved_On_Time , 
    0 )

RETURN
_Percentage_Of_True_or_False

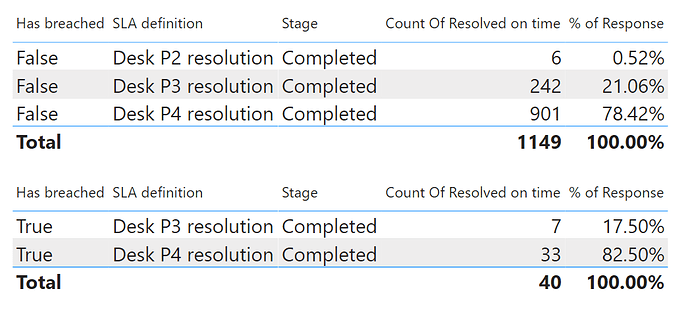
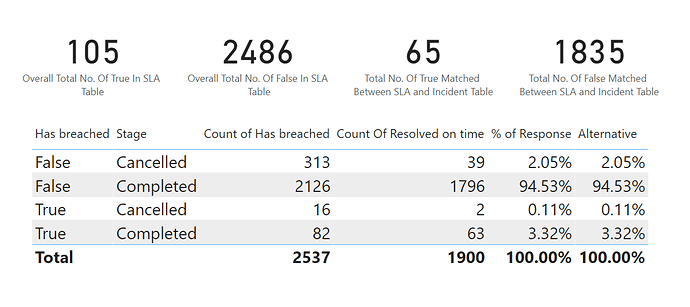
You don’t have to write individual formulas to derive at the indpividual results. See the results of the screenshots provided below -

  1. Count the values of column 2 in Table 2 (true or false column)
  2. Compare columns 1 from Tables 1 & 2 (incident key reference)

  1. Provided column 3 in Table 1 meets certain criteria (resolved or closed)
  2. Based on criteria in column 3 of Table 2. (type of SLA, contains the word resolution)

  1. And column 4 of Table 2 is not set to pause or cancelled

I need to then count the has breached column in the SLA table, if the value is false, provided the SLA definition has the word resolution in it, and the stage column in the SLA table is not set to pause or cancelled.

I’m also attaching the working of Excel as well as PBIX file for the reference.

Hoping this meets your requirements that you’ve been looking for. :slightly_smiling_face:

Note:

  1. All the results are cross-verified by performing “VLOOKUP” function in Excel. Refer Excel for reference purpose.

  2. Upon comparing the two tables, the results of “In Progress” and “Pause” gets by default eliminated since “Incident” table doesn’t have any Incident Numbers that matches with this two criteria. The criteria with which you’ll be left with is either “Completed” or “Cancelled”. Again refer Excel file for this.

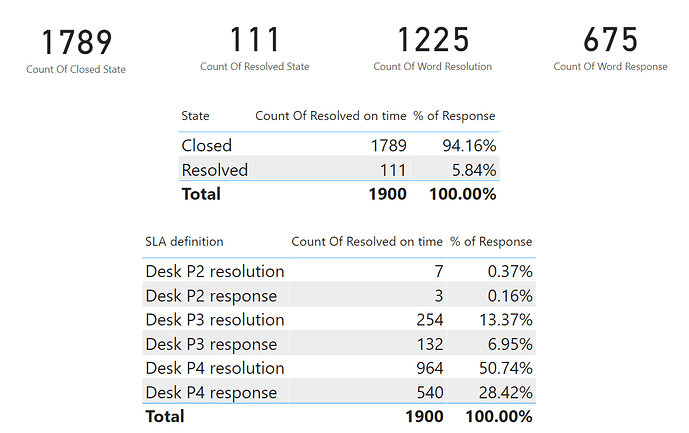
  3. Also criteria for “Desk P1 Resolution” also gets eliminated since “Incident” table don’t have the records or Incident Numbers that matches this type of criteria from the “SLA” table. Again go through the Excel File for refernce purpose to cross - verify the results.

  4. If criteria “Resolved” or “Closed” is matched than by default it means that Incident Number from the “Incident” table matches with the Incident Number froom the “SLA” table.

  5. You had specified in your original post before editing that you were not sure how to use the “RELATED()” function. Below is the link of that video provided for the reference as well.

Lastly, can I ask you a small query. Have you visited our courses OR videos onto the education portal?

Thanks and Warm Regards,
Harsh

incident - Harsh.xlsx (150.6 KB)

sampledata - Harsh.pbix (70.8 KB)

1 Like

@Harsh Thank you for this.

Is there any way to achieve what you did with the filter visuals by using DAX measure?

If I use a single score visual, and enter in the measure, the metric should give 94.53%. This is the actual metric - % of tickets resolved on time

Thank you

Hello @seunao,

Please provide the entire screenshot/file for the reference than providing a small snippet of it.

And if you’ve checked the file than you’ll observe that you can change the context of the formulas as per your requirements as well.

And as I requested, have you gone through any of the basic courses or videos yet from our education portal?

Thanks and Warm Regards,
Harsh

Hello @Harsh -Thanks for getting back to me. Yes, I am trying to learn the videos and build this out simultaneously (not very easy). I am going through them daily, it is just that I have a window to finish the work.

I am still looking at the files you sent in, trying to modify them accordingly.

I apologise, the screenshot was from the file you sent, hence I sent only the snippet

Thank you

Hello @seunao,

But it’s still unclear to me about where’s the problem here? Which part is not providing the results that you’re actually looking for. The results that you’re seeing in the file are evaluated by DAX itself except “Count of Has breached”.

Thanks and Warm Regards,
Harsh

Hi Harsh,

I apologise for the delayed response and lack of clarity.

My question is it is possible to get the same result applying the filters in a DAX formula, vs using the filters from the visuals as you have currently explained it.

It is the Dax measure I am trying to get to use to get the same result without using visual filters.

hopefully this is clearer.

Hello @seunao,

My question is it is possible to get the same result applying the filters in a DAX formula, vs using the filters from the visuals as you have currently explained it.

Are you talking about the usage of FILTER PANE that I’ve made? I’ve used it as a technique to achieve the results rather than writing individual measures to achieve individual results.

It is the Dax measure I am trying to get to use to get the same result without using visual filters.

If you’re trying to get used to the DAX than please go through the videos or courses availble onto the education portal for learning purposes.

If your original query is resolved than please close this thread.

Thanks and Warm Regards,
Harsh

Thanks for your feedback and all your assistance @Harsh

Your approach with the filter pane solves a problem, not necessarily my query.
I am still trying to write the dax to solve the query as it is part of a much large project, and so the use of filters may make it quite clunky if I use too many of those, and impossible to manage and keep up with.

Yes, I am simultaneously learning the videos, building the project, and getting assistance as I proceed. I hope that is ok.
I apologise if you find my questions trivial, I have barely 2 weeks of power BI or Dax knowledge.

I am hoping to still ask questions about this metric as I try to build out the dax for this, so hopefully I can leave this unresolved for now.

Once again, thanks for your help.

Hello @seunao,

Firstly, please absolutely don’t apologise. On the forum, all the questions are welcomed here. When members ask questions onto the Forum we also learn something from them. No question is small here.

Now, when I said I used the technique to achieve the results just by writing 2 measures or 1 single consolidated measure it meant that it’s the best possible and feasible way. Let’s presume you’ve large model than what will you do? Will you go for 2 measures that optimizes your model or will you for individual measures that makes your model further bulky.

To achieve same results I’ve written 13 measures. Now, I leave the choice upto you which option suits you the better.

Note: I’m vocal and do advocate the “Measure Branching Technique” onto the forum but not at the cost of the model size. The solution which I provided earlier also showcased “Measure Branching Technique” as well as “Variable Technique”. Now, here’re the 13 measures provided for your reference.

1). Count Of Has Breached -

Count Of Has Breached = COUNTROWS( SLA )

2). Overall Total No. Of True In SLA Table -

Overall Total No. Of True In SLA Table = 
CALCULATE( COUNTROWS( SLA ) , 
    SLA[Has breached] = "TRUE" )

3). Overall Total No. Of False In SLA Table -

Overall Total No. Of False In SLA Table = 
CALCULATE( COUNTROWS( SLA ) , 
    SLA[Has breached] = "FALSE" )

4). Total No. Of True Matched Between SLA and Incident Table -

Total No. Of True Matched Between SLA and Incident Table = 
CALCULATE( COUNTROWS( SLA ) ,
    FILTER( SLA ,
        SLA[Task] = RELATED( Incident[Number] ) ) , 
    SLA[Has breached] = "TRUE" )

5). Total No. Of False Matched Between SLA and Incident Table -

Total No. Of False Matched Between SLA and Incident Table = 
CALCULATE( COUNTROWS( SLA ) ,
    FILTER( SLA ,
        SLA[Task] = RELATED( Incident[Number] ) ) , 
    SLA[Has breached] = "FALSE" )

6). Count Of Closed State -

Count Of Closed State = 
CALCULATE( COUNTROWS( SLA ) ,
    FILTER( SLA ,
        SLA[Task] = RELATED( Incident[Number] ) ) ,
    Incident[State] = "Closed" )

7). Count Of Resolved State -

Count Of Resolved State = 
CALCULATE( COUNTROWS( SLA ) ,
    FILTER( SLA ,
        SLA[Task] = RELATED( Incident[Number] ) ) ,
    Incident[State] = "Resolved" )

8). Count Of Word Resolution -

Count Of Word Resolution = 
CALCULATE( COUNTROWS( SLA ) ,
    FILTER( SLA ,
        SLA[Task] = RELATED( Incident[Number] ) ) , 
    CONTAINSSTRING( SLA[SLA definition] , "resolution" ) )

9). Count Of Word Response -

Count Of Word Response = 
CALCULATE( COUNTROWS( SLA ) ,
    FILTER( SLA ,
        SLA[Task] = RELATED( Incident[Number] ) ) , 
    CONTAINSSTRING( SLA[SLA definition] , "response" ) )

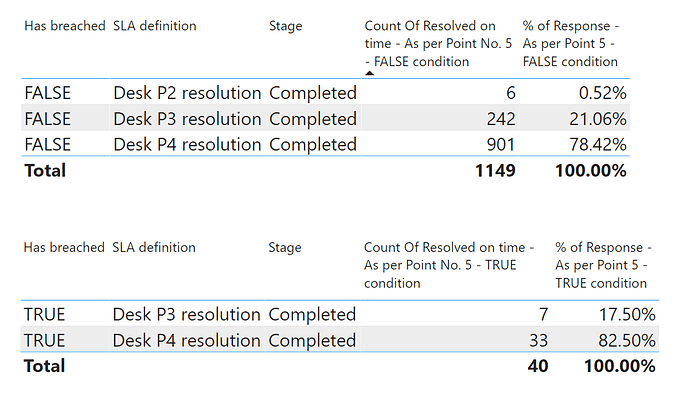
10). Count Of Resolved on time - As per Point No. 5 - FALSE condition -

Count Of Resolved on time - As per Point No. 5 - FALSE condition = 
CALCULATE( COUNTROWS( SLA ) ,
    FILTER( SLA ,
        SLA[Task] = RELATED( Incident[Number] ) ) , 
    SLA[Has breached] = "FALSE" , 
    CONTAINSSTRING( SLA[SLA definition] , "resolution" ) , 
    SLA[Stage] = "Completed" )

11). % of Response - As per Point 5 - FALSE condition -

% of Response - As per Point 5 - FALSE condition = 
DIVIDE( 
    [Count Of Resolved on time - As per Point No. 5 - FALSE condition] , 
    CALCULATE( [Count Of Resolved on time - As per Point No. 5 - FALSE condition] , 
        ALLSELECTED( SLA ) ) ,
    0 )

12). Count Of Resolved on time - As per Point No. 5 - TRUE condition -

Count Of Resolved on time - As per Point No. 5 - TRUE condition = 
CALCULATE( COUNTROWS( SLA ) ,
    FILTER( SLA ,
        SLA[Task] = RELATED( Incident[Number] ) ) , 
    SLA[Has breached] = "TRUE" , 
    CONTAINSSTRING( SLA[SLA definition] , "resolution" ) , 
    SLA[Stage] = "Completed" )

13). % of Response - As per Point 5 - TRUE condition -

% of Response - As per Point 5 - TRUE condition = 
DIVIDE( 
    [Count Of Resolved on time - As per Point No. 5 - TRUE condition] , 
    CALCULATE( [Count Of Resolved on time - As per Point No. 5 - TRUE condition] , 
        ALLSELECTED( SLA ) ) ,
    0 )

Now, after writing all these measure they simply provide the same results like they were providing it before. Below are the screenshots provided for the reference -

So if they provide the same results. I would like to ask you what’s the point of writing this many measures? How will they actually help in your analysis like you’ve suggested in your previous post? As I said the choice is yours whichever option suits you the better.

I’m attaching the working of the PBIX file for the reference. And in the file refer the section of “Individual Measures”.

Lastly, you can keep the thread open as long as you wish. But if the query differs from the original query than it’ll violate the forum rules because only one query is allowed per thread. So again choice is yours here as well.

Hoping you find this measures useful and helpful and meets your requirements that you’ve been looking for.

Thanks and Warm Regards,
Harsh

sampledata - Harsh v2.pbix (76.6 KB)
1 Like