Hi Fellow Power BI Users -
I feel lost with the problem I’m expericing on this model.
The aim of this model is to be able to compare quotations from different suppliers for every purchasing round, and every Project GPN number.
During the Purchasing negotiotation you may have manifold interactions with suppliers. Consequently The list of suppliers may vary in every round (some of them leave, others are added after)…
As consequence this is a dynamic model, this means for GPN XXXXXX you may have supplier 1, 2 and 4, but they may differ for Project GPN YYYYYY… so you can’t use calculations like Calculate (TCO, Supplier Name = “Supplier 1”) or similar…
I was able to solve this problem when only two quotation appeared in a determined Project GPN and Round, calculating the difference between the SELECTEDVALUE and the TOTAL VALUE using ALL function like follows:
Difference % =
VAR SupplierRef = SELECTEDVALUE(Tabla2[Walkround]; BLANK())
VAR TOTALValueSelected = CALCULATE(SUM(Tabla2[Total Price (Calculated)]); Tabla2[Walkround]= SupplierRef)
VAR TotalValueVendors = CALCULATE(SUM(Tabla2[Total Price (Calculated)]); ALL(Tabla2[Walkround]))
RETURN
IF(TOTALValueSelected - (TotalValueVendors-TOTALValueSelected) < 0 ; "-Δ" & FORMAT(-1*(TOTALValueSelected - (TotalValueVendors-TOTALValueSelected)) / TotalValueVendors;"Percent"))
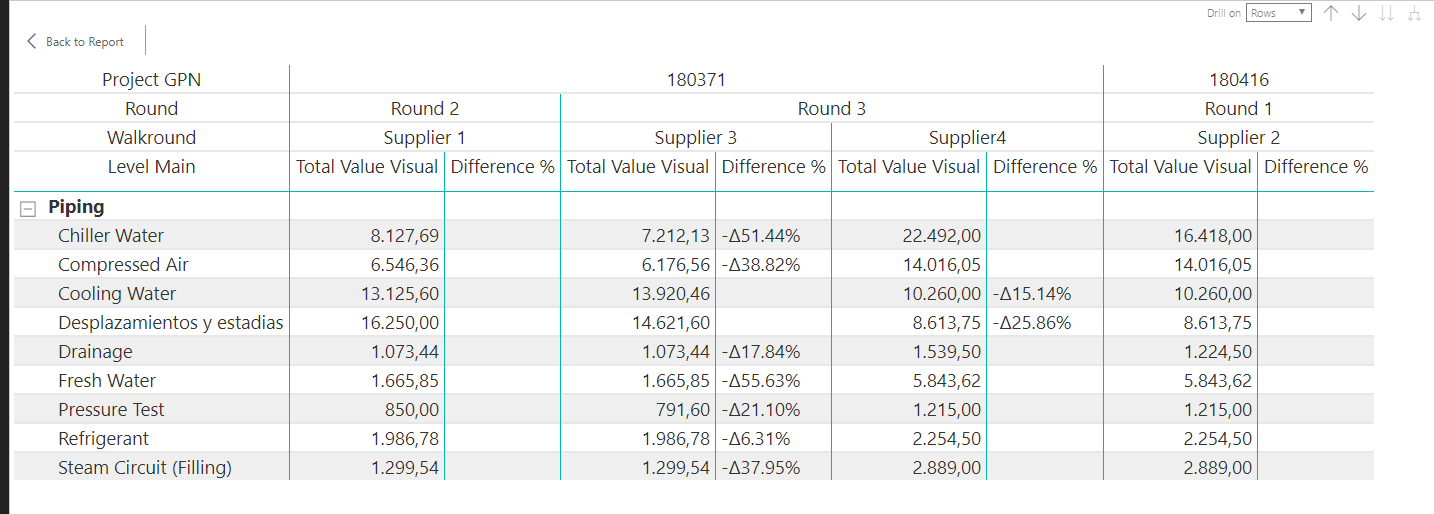
For this Round you have received 2 quotations from 2 different suppliers. To compare, you would have to find the lowest value and calculate the “delta” (difference) with the other more expensive quotations.
On top of this, we have two Row Level, Main Category and Sub Category, where you can show/hide (or drill down). I was doubting if a ISFILTER condition might be needed like we did with a Rank Scenario;
Could you help me to build de DAX Measure considering the Levels in Rows, and having more tan 2 quoation in a Project and Round?
