Hi there,
I am trying to calculate the Mean Absolute Percent Variation (MAPV) of my sales demand, which is defined as equal to the average absolute deviation from the historical mean demand divided by the historical mean demand and expressed as a percent.
To do so, I need to:
- Calculate the average demand.
- Calculate the absolute deviation as the difference between the sales demand minus the average demand by row.
- Calculate the average absolute deviation.
- Divide the average abs deviation by the average demand to get my metric.
I am getting stuck on point 2. I am trying to run this calculation so I can see the MAPV by month, here is my formula:
Abs Deviation =
VAR avg_demand =
CALCULATE (
AVERAGE ( Demand_Forecast_Fact[Demand] ),
DATESBETWEEN (
Date_Lookup[Date],
STARTOFMONTH ( Date_Lookup[Date] ),
ENDOFMONTH ( Date_Lookup[Date] )
)
)
RETURN
ABS ( SUM ( Demand_Forecast_Fact[Demand] ) - avg_demand )
In theory, this formula should remove the date filter from the table and calculate the monthly average for the month selected. It looks like it’s working at a row level.
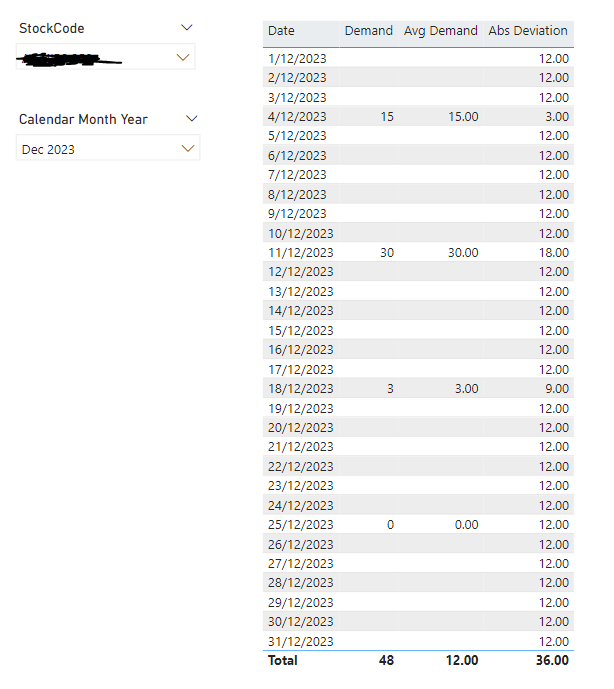
However, the total value is incorrect.
As you can see the Abs Deviation at the bottom of the table should be (|15-3| + |30-12| + |3-12| + |0-12|) = 42. Instead it is showing 36 which I assume is Total Demand - Average(|48-12|).
Any idea on how to solve this?
Thanks,
Alberto.