@ScottTPA,
This is a really interesting problem. If you take the data as is, it’s incredibly difficult to get the result you want. However, if you reshape the data in Power Query, it’s two short measures to get right to the desired result:
Total Billed Revenue = SUM( 'Subscriptions Transformed'[Billed Revenue] )
and
Billed Revenue by Month TREATAS =

CALCULATE(
    [Total Billed Revenue],
    TREATAS(
        VALUES( Dates[MonthnYear] ),
        'Subscriptions Transformed'[Billed MoInYr]
    )
)
Drop the second measure into a table or matrix with the month on rows and you get this:
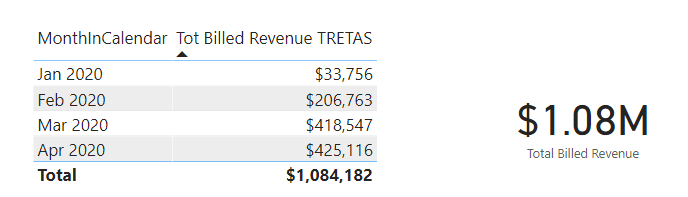
I used TREATAS here for two reasons:
- The transformed fact table data I created had no relationship in the model to the date table (though I could have linked them together via the date columns)
- More importantly, the relationship between the tables based on MonthInYear is a many-to-many relationship that is handled perfectly by TREATAS.
The heavy lift here is done by Power Query. Here’s an outline of the general strategy I used to transform the data:
-
where End Subscription Date was blank (N/A), I used today’s date as the end month for revenue collection (this solution is dynamic, and will recalculate every time with the new end date until the subscriber cancels)
-
created the MonthInYear numeric format to correspond to the start and end subscription dates (e.g. 20200400 for April 2020).
-
for each subscriber, I created a list of MonthInYear numbers in sequence incremented by 100 to represent one observation for each month that they were subscriber between the start and end dates, and then expanded that list by values with a space delimiter between them
-
then I unpivoted the list created in 3) to create a separate record for each subscriber and each month of subscription.
-
then created a billed revenue column, where if the MonthInYear value in the unpivoted column equaled the start subscription MonthInYear value, the column utilized the initial price, otherwise it used the recurring price.
Here’s what the transformed table looks like:
From there you just apply the DAX above, and I think you should be good to go.
Here’s the M code for the transformation, with full solution file posted below.
let
    Source = Excel.Workbook(File.Contents("C:\Users\brjul\Downloads\Subscription - Anonymous Data.xlsx"), null, true),
    Subscriptions_Sheet = Source{[Item="Subscriptions",Kind="Sheet"]}[Data],
    #"Promoted Headers" = Table.PromoteHeaders(Subscriptions_Sheet, [PromoteAllScalars=true]),
    #"Changed Type" = Table.TransformColumnTypes(#"Promoted Headers",{{"Subscription ID", Int64.Type}, {"Subscription Status", type text}, {"Initial Price", type number}, {"Recurring Price", type number}, {"Subscription Created At", type date}, {"Subscription Start Date", type date}, {"Subscription End Date", type any}, {"Next Rebilling Date", type date}}),
    #"Replaced Value" = Table.ReplaceValue(#"Changed Type","N/A",null,Replacer.ReplaceValue,{"Subscription End Date"}),
    #"Changed Type1" = Table.TransformColumnTypes(#"Replaced Value",{{"Subscription End Date", type date}}),
    #"Duplicated Column" = Table.DuplicateColumn(#"Changed Type1", "Subscription End Date", "Subscription End Date - Copy"),
    #"Added Custom" = Table.AddColumn(#"Duplicated Column", "Today", each Date.From(DateTime.LocalNow())),
    #"Changed Type2" = Table.TransformColumnTypes(#"Added Custom",{{"Today", type date}}),
    #"Sorted Rows" = Table.Sort(#"Changed Type2",{{"Subscription End Date - Copy", Order.Descending}}),
    #"Added Conditional Column" = Table.AddColumn(#"Sorted Rows", "EndRevDate", each if [Subscription End Date] = null then [Today] else [Subscription End Date]),
    #"Removed Other Columns" = Table.SelectColumns(#"Added Conditional Column",{"Subscription ID", "Initial Price", "Recurring Price", "Subscription Start Date", "EndRevDate"}),
    #"Added Custom Column" = Table.AddColumn(#"Removed Other Columns", "Start MoInYr", each Text.Combine({Date.ToText([Subscription Start Date], "yyyy"), Date.ToText([Subscription Start Date], "MM"), "00"}), type text),
    #"Changed Type3" = Table.TransformColumnTypes(#"Added Custom Column",{{"Start MoInYr", Int64.Type}}),
    #"Added Custom1" = Table.AddColumn(#"Changed Type3", "End MoInYr", each Text.Combine({Date.ToText([EndRevDate], "yyyy"), Date.ToText([EndRevDate], "MM"), "00"})),
    #"Changed Type4" = Table.TransformColumnTypes(#"Added Custom1",{{"End MoInYr", Int64.Type}}),
    #"Added Custom3" = Table.AddColumn(#"Changed Type4", "Number of Months", each ([End MoInYr] - [Start MoInYr]+100)/100),
    #"Renamed Columns" = Table.RenameColumns(#"Added Custom3",{{"Number of Months", "Revenue Months"}}),
    #"Added Custom2" = Table.AddColumn(#"Renamed Columns", "ListMoInYr", each List.Numbers( [Start MoInYr], [Revenue Months], 100 )),
    #"Extracted Values" = Table.TransformColumns(#"Added Custom2", {"ListMoInYr", each Text.Combine(List.Transform(_, Text.From), " "), type text}),
    #"Split Column by Delimiter" = Table.SplitColumn(#"Extracted Values", "ListMoInYr", Splitter.SplitTextByDelimiter(" ", QuoteStyle.Csv), {"ListMoInYr.1", "ListMoInYr.2", "ListMoInYr.3", "ListMoInYr.4"}),
    #"Changed Type5" = Table.TransformColumnTypes(#"Split Column by Delimiter",{{"ListMoInYr.1", Int64.Type}, {"ListMoInYr.2", Int64.Type}, {"ListMoInYr.3", Int64.Type}, {"ListMoInYr.4", Int64.Type}}),
    #"Unpivoted Columns" = Table.UnpivotOtherColumns(#"Changed Type5", {"Subscription ID", "Initial Price", "Recurring Price", "Subscription Start Date", "EndRevDate", "Start MoInYr", "End MoInYr", "Revenue Months"}, "Attribute", "Value"),
    #"Removed Columns" = Table.RemoveColumns(#"Unpivoted Columns",{"Attribute"}),
    #"Renamed Columns1" = Table.RenameColumns(#"Removed Columns",{{"Value", "Billed MoInYr"}}),
    #"Added Conditional Column1" = Table.AddColumn(#"Renamed Columns1", "Billed Revenue", each if [Billed MoInYr] = [Start MoInYr] then [Initial Price] else [Recurring Price]),
    #"Changed Type6" = Table.TransformColumnTypes(#"Added Conditional Column1",{{"Billed Revenue", Int64.Type}})
in
    #"Changed Type6"
I hope this is helpful. Definitely an interesting problem…


 I learn several new things every time I post here.