Bump Chart Hover Implementation

Hi all,
Thank you for taking to time to look at my challenge.
I have created a bump chart in Deneb, with code borrowed from the awesome Darren Gosbell: Darren’s Blog who also credits the wonderful Kerry Kerry’s Blog.

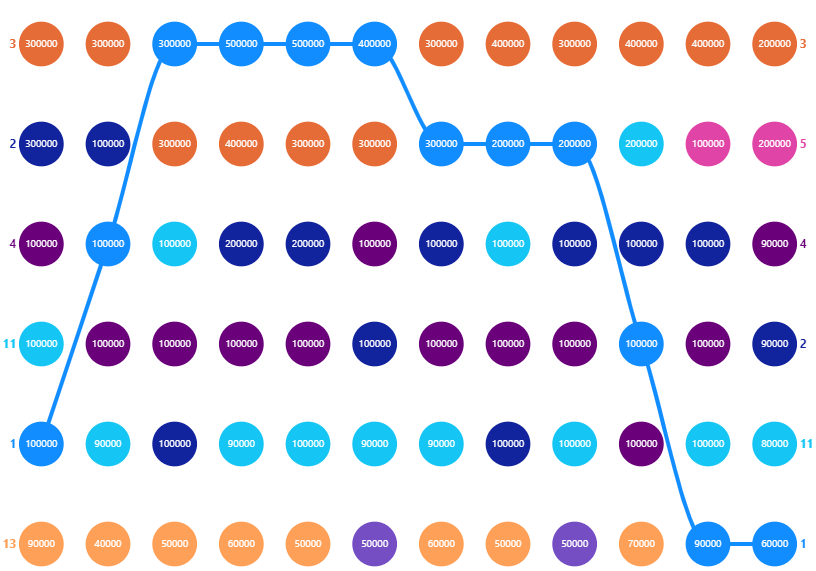
I have adapted the logic to my case as 20 projects with a monthly sales value through a year. The visual shows the monthly sales rank by project for each month.
I have cleaned up the noise on the visual by removing the lines and only having them show when hovering over the line:


The vega-lite I added to do this is as follows in the “Lines Layer” line 96 (see pbix)

  "selection": {
    "hover": {
      "type": "single",
      "fields": ["Project ID", "Project_MonthlySales_Rank"],
      "on": "mouseover",
      "empty": "none",
      "clear": "mouseout"
    }
  }

What I want to do next is also implement that same logic so the line layer is visible on mouseover when hovering over the “Project ID” field on both y axis as well as when hovering over the circle layer. You can see I have attempted to do this above by adding the “Project ID” field to the hover fields but that isn’t the trick.

Does anyone know how I can add a hover for a mark when mouseover a different mark?

I have tried introducing parameters at the top level to refer to later, such as:

“params”: [
{
“name”: “hover”,
“select”: {
“type”: “point”,
“fields”: [“Project Seasonality_Facts_Project Name”, “Project_MonthlySales_Rank”],
“on”: “mouseover”,
“clear”: “mouseout”
}
}
],
but I was getting [Error] Duplicate signal name: “hover_tuple”.

Here is my .pbix
Deneb Bump Chart.pbix (1.5 MB)

Thank you in advance

1 Like

Hi @jordan.s.p.williams6 ,

Adding a Hover Effect

Current Selection Definition

Currently, your selection definition looks like this:

"selection": {
  "hover": {
    "type": "single",
    "fields": ["Project ID", "Project_MonthlySales_Rank"],
    "on": "mouseover",
    "empty": "none",
    "clear": "mouseout"
  }
}

Copy

Code Explainer

Step-by-Step Solution

  1. Define Parameters for Hover Interactions: You can use parameters at the top level to manage the selection state across different marks.
  2. Modify Layer Structure: Adjust the layers to include conditional formatting based on the hover parameter.
  3. Example Vega-Lite Specification:

Here’s a modified example, including a parameter and using it to manage hover states:

{
  "$schema": "https://vega.github.io/schema/vega-lite/v5.json",
  "params": [
    {
      "name": "hover",
      "select": {
        "type": "point",
        "fields": ["Project ID", "Project_MonthlySales_Rank"],
        "on": "mouseover",
        "clear": "mouseout"
      }
    }
  ],
  "layer": [
    {
      "mark": "line",
      "encoding": {
        "x": {"field": "Month", "type": "temporal"},
        "y": {"field": "Project_MonthlySales_Rank", "type": "quantitative"},
        "color": {"field": "Project ID", "type": "nominal"},
        "opacity": {
          "condition": [
            {"test": "hover", "value": 1}
          ],
          "value": 0
        }
      }
    },
    {
      "mark": "circle",
      "encoding": {
        "x": {"field": "Month", "type": "temporal"},
        "y": {"field": "Project_MonthlySales_Rank", "type": "quantitative"},
        "color": {"field": "Project ID", "type": "nominal"},
        "opacity": {"value": 1}
      }
    }
  ]
}

Copy

Code Explainer

Explanation

  1. Params: Defines a parameter hover which selects a point based on mouseover.
  2. Line Layer: Uses an opacity encoding conditionally based on the hover parameter; the line becomes fully opaque when hovered.
  3. Circle Layer: Circles remain always fully opaque for better visibility.

Note: If you encounter issues with duplicate signal names, ensure that each parameter or selection has a unique name and is scoped correctly within your Vega-Lite specification.

Additional Learning Resources

To further enhance your skills in Power BI and Visualizations, consider exploring the following courses on Enterprise DNA:

  • Advanced Data Visualization Techniques: Learn about creating complex and interactive visualizations in Power BI.
  • Custom Visuals Development in Power BI: Gain insights into developing custom visuals using tools like Vega-Lite and D3.js.

For detailed support and tailored assistance, you can also post your query on Data Mentor (https://mentor.enterprisedna.co/queries).

Cheers,

Enterprise DNA Support Team

3 Likes

Thank you. I have tried ChatGPT too but unfortunately it can’t crack this one with my prompts.
We cannot define the parameter outside the layer without getting the hover_tuple error. I don’t have the expertise to understand why but neither does ChatGPT.

Perhaps if I take a step back it might be easier for the community to help: does anyone know how to change the colour of a line mark by hovering over a circle mark?

For example I have put this together:

{
  "$schema": "https://vega.github.io/schema/vega-lite/v5.json",
  "data": {
    "values": [
      {"x": 1, "y": 3},
      {"x": 2, "y": 5},
      {"x": 3, "y": 7},
      {"x": 4, "y": 6},
      {"x": 5, "y": 8}
    ]
  },
  "layer": [
    {
      "params": [
        {
          "name": "hover",
          "select": {
            "type": "point",
            "on": "mouseover",
            "clear": "mouseout"
          }
        }
      ],
      "mark": {
        "type": "circle",
        "size": 100
      },
      "encoding": {
        "x": {"field": "x", "type": "quantitative"},
        "y": {"field": "y", "type": "quantitative"},
        "opacity": {"value": 1}
      }
    },
    {
      "mark": {
        "type": "line",
        "tooltip": true
      },
      "encoding": {
        "x": {"field": "x", "type": "quantitative"},
        "y": {"field": "y", "type": "quantitative"},
        "color": {
          "condition": {
            "param": "hover",
            "empty": false,
            "value": "red"
          },
          "value": "blue"
        }
      }
    }
  ]
}

This almost works. Hilariously it works for the very first circle where x=1 y=3 but not the others.
Any ideas? Perhaps the parameter is not the best use?

Kind regards

1 Like

Hi all,
Following up as I’ve got a solution. As is usually the case, it was a simple change but it took me a while to get to it :slight_smile:

Expanding on the more basic implementation in my above reply, I added a series so that there would be 3 lines and a circle on each data point.
The goal was to get all circles and the line to highlight for the whole series that was selected.
(In my previous reply it would only highlight for a single circle or if the first circle was highlighted, that would highlight the line too)

The key was simply adding the category fields to the hover parameter

      "params": [
        {
          "name": "hovercircle",
          "select": {
            "type": "point",
            "on": "pointerover",
            "fields": ["category"]
          }
        }
      ]

Maybe painfully obvious to some :slight_smile:

The more tricky part was getting the line hover to also highlight all the circles.
My solution was to add another hover parameter but not to reference it in the encoding, instead reference the hovercircle. I can’t quite get my head around this behaviour to be honest.

But here is the full code

{
  "$schema": "https://vega.github.io/schema/vega-lite/v5.json",
  "description": "An example where hovering over points affects the transparency of bars.",
  "data": {
    "values": [
      {"category": 1, "month": 1, "value": 40}, {"category": 1, "month": 2, "value": 70}, {"category": 1, "month": 3, "value": 50},
      {"category": 1, "month": 4, "value": 91}, {"category": 1, "month": 5, "value": 81}, {"category": 1, "month": 6, "value": 60},
      {"category": 1, "month": 7, "value": 40}, {"category": 1, "month": 8, "value": 87}, {"category": 1, "month": 9, "value": 60},
      
      {"category": 2, "month": 1, "value": 34}, {"category": 2, "month": 2, "value": 60}, {"category": 2, "month": 3, "value": 38},
      {"category": 2, "month": 4, "value": 75}, {"category": 2, "month": 5, "value": 76}, {"category": 2, "month": 6, "value": 47},
      {"category": 2, "month": 7, "value": 30}, {"category": 2, "month": 8, "value": 75}, {"category": 2, "month": 9, "value": 50},
      
      {"category": 3, "month": 1, "value": 25}, {"category": 3, "month": 2, "value": 50}, {"category": 3, "month": 3, "value": 30},
      {"category": 3, "month": 4, "value": 65}, {"category": 3, "month": 5, "value": 59}, {"category": 3, "month": 6, "value": 41},
      {"category": 3, "month": 7, "value": 21}, {"category": 3, "month": 8, "value": 60}, {"category": 3, "month": 9, "value": 39}
    ]
  },
  "layer": [
    {
      "params": [
        {
          "name": "hovercircle",
          "select": {
            "type": "point",
            "on": "pointerover",
            "fields": ["category"]
          }
        }
      ],
      "mark": "circle",
      "encoding": {
        "x": {"field": "month", "type": "ordinal"},
        "y": {"field": "value", "type": "quantitative"},
        "color": {"field": "category"},
        "size": {"value": 100},
        "opacity": {
          "condition": {
            "param": "hovercircle",
            "value": 1
          },
          "value": 0.3
        }
      }
    },
    {
      "params": [
        {
          "name": "hoverline",
          "select": {"type": "point", "on": "pointerover"}
        }
      ],
      "mark": "line",
      "encoding": {
        "x": {"field": "month", "type": "ordinal"},
        "y": {"field": "value", "type": "quantitative"},
        "color": {"field": "category"},
        "opacity": {
          "condition": {
            "param": "hovercircle",
            "value": 1
          },
          "value": 0.1
        }
      }
    }
  ],
  "height": 600,
  "width": 600
}

Kind regards