I have a basic power bi model comparing a P+L budget with a P+L actual. The source data is a trial balance report taken from our erp with actual and budget in separate tables and the data within each is split by month, GL and department.
I can build tables showing budget vs actual variances, so far so good. But I am struggling to workout how to turn that into a waterfall chart so I could take the budget profit and waterfall gl variances to arrive at the actual, or take budget sales and show department variances to arrive at actual sales.
Every waterfall example I have looked at analyses between dates.
Yes, usually waterfall examples are related to the dates. why are you using some kind of date/month in your variance? So you aren’t using a Date Table within your model? Best practice in a P and L is using Date table.
Did you try askiing the question to ChatGPT/another AI tool?
I was being simplistic in my model description, there is a date table and also tables to link GL to a hierarchy and profit centre to a department schedule.
I am trying to use a waterfall to compare a variance between common items on two tables (budget and actual) rather than the examples I have seen which is a variance in a single table over time.
I can do it relatively easily in excel but replicating in powerbi is defeating me!
Your dataset as an Excel file (again, sanitized if necessary)
A detailed mock-up showing your desired outcome (you noted you could do this easily in Excel, so please do as it will help the forum members respond to your issue)
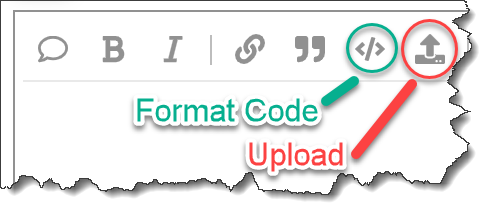
Also, if you provide DAX, Power Query, or Deneb JSON code in your post, please format it using the built-in formatter.