Budget-to-Actual report using Income Statement Format

Hello, so I am trying to develop a budget-to-actual report using the Income Statement format but I have no idea how to develop the right data model. My initial try was through MS PowerPivot and I almost had it, but even then I wasn’t able to calculate the net income. And when I tried it in Power BI, it completely threw me off. Will really appreciate your help on this one. Thanks.

image

HI_Rentals_Budget-to-Actual Report.pbix (111.9 KB)

Hello @SonOfWilliam,

Thank You for posting your query onto the Forum.

Is this the type of result you’re looking into the Power BI? Below is the screenshot provided for the reference -

The problems were with the formulas actually. You had a simple formulas and then you tried to substitute them into the formats/tables that you had created. I’ve revised all the formulas a bit. Below are the formulas provided for the reference that I’ve used into the tables -

Budget = 
CALCULATE( SUM( HI_Budget_Data[Budget Amount] ) , 
    TREATAS( VALUES( Accounts_Table[Accounts] ) , HI_Budget_Data[Account] ) , 
    TREATAS( VALUES( HI_SubAccounts_Table[Sub Accounts] ) , HI_Budget_Data[Sub Account] ) )


Actual = 
CALCULATE( SUM( HI_Transactions_Table[Actual Amount] ) , 
    TREATAS( VALUES( Accounts_Table[Accounts] ) , HI_Transactions_Table[Account] ) , 
    TREATAS( VALUES( HI_SubAccounts_Table[Sub Accounts] ) , HI_Transactions_Table[Sub Account] ) )

Variance = [Budget] - [Actual]

Variance % = DIVIDE( [Variance] , [Budget] , 0 )

I’m also attaching the working of the PBIX file for the reference.

If you need anything just give a shout and will always be happy to help.

Hoping you find this useful and helps you in your analysis to achieve the desired result that you’re looking for. :slightly_smiling_face:

Thanks and Warm Regards,
Harsh

HI_Rentals_Budget-to-Actual Report - Harsh.pbix (110.1 KB)

1 Like

Hello @SonOfWilliam,

The simple formulas that you’ve written also provides the same as mine. Below is the screenshot provided for the reference -

Did you tried to drag the “Accounts” and “Sub-Accounts” columns from either the “HI_Budget_Data” table or “HI_Transactions_Table” table? And that would be the reason why you might have got an erroneous results something like this. Below is the screenshot provided for the reference -

Income Statement - 3

This error happened because the “HI_Budget_Data” table is not linked with the “HI_Transactions_Table” table.

I’m also attaching the working of the PBIX file again for the reference.

Please Note:

  1. The (SOW) written in the formulas represents “Son Of William” your name.

  2. Also a quick note on the Variance % formula that you’d written. Always try using the “DIVIDE()” function instead of “Forward Slash (/)” so that if you divide any number by zero rather than having the answer as “Infinity” you can substitute with the alternative result either with the Blank or with the the Zero (0).

Hoping you find this useful. :slightly_smiling_face:

Thanks and Warm Regards,
Harsh

HI_Rentals_Budget-to-Actual Report - Harsh v2.pbix (112.3 KB)

Hi @SonOfWilliam,

My recommendation is to have actuals first and then budget in the next column. Most financial statements start with actual first.

thanks
Keith

@Harsh, you awesomeness personified. This is great, many thanks. And by the way, what kind of visualization is that, and where can I learn it in Enterprise DNA?

Thanks Keith, will keep that in mind.

@SonOfWilliam

welcome

You are right, my formulas left a lot to be desired, but what impressed me the most is you were able to get the desired result with a model that I thought was wrong or did you change it somehow? And this DAX wizardry you just wrote, can I learn all this in here?

How do I change the Total to Net Income (Revenue - Expenses) instead of the Revenue + Expenses ?? thanks!

Hello @SonOfWilliam,

You’re Welcome my friend. :slightly_smiling_face:

I’m glad that I was able to help you.

Well the visualization that I’ve used is the Matrix table. And there’s a course specifically designed and available onto our education portal. This course specifically addresses about how one can analyze and prepare the Financial Statements in Power BI and you can also show them by preparing the customized formats. All you queries will be answered into this course i.e. from A to Z.

Also providing a link of video about the TREATAS function that I’ve used. And nope, I haven’t made any changes into the data model it is as it is.

Hoping you’ll find this useful and many, many thanks to you my friend for your great words of appreciation. :slightly_smiling_face:

Please Note: If you require anything else I’ll be more than happy to help you just my reply will be delayed because now I’ll be travelling for few hours for my State match practice.

Thanks and Warm Regards,
Harsh

Hello @SonOfWilliam,

Can I answer this in few hours? As I’ll have to hit the road on time with my team.

My sincerest of apologies for the inconveniences caused to you.

Once I get back, I’ll surely answer to this question. :+1:

Thanks and Warm Regards,
Harsh

Not a problem, I can wait. All the best out there.

Hello @SonOfWilliam,

Thank You for waiting to me to post my solution. :slightly_smiling_face:

Ok, so firstly I’ll provide the formulas that I’ve written and then will attach the screenshot of the final result.

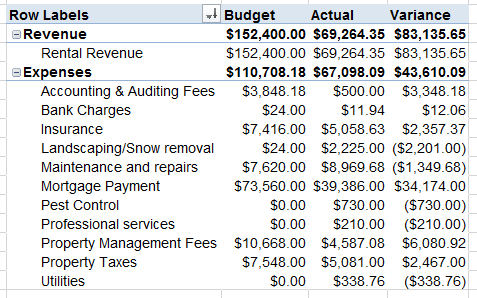
So within each measure I’ve tried to calculate the sub-totals of each “Category”. i.e. sub-totals for the revenue and sub-totals for the Expenses. And then subtracting the Expenses sub-totals from the “Revenues”.

Step 1: Calculation of Actuals Totals i.e. (Revenues and Expenses) -

Actuals Totals = 
VAR Revenues = 
CALCULATE( [Actual] , 
    FILTER( Accounts_Table , 
        Accounts_Table[Accounts] = "Revenue" ) )


VAR Expenses = 
CALCULATE( [Actual] , 
    FILTER( Accounts_Table , 
        Accounts_Table[Accounts] = "Expenses" ) )

VAR Result = Revenues - Expenses

RETURN
Result

Step 2: Calculation of Budgets Totals i.e. (Revenues and Expenses) -

Budgets Totals = 
VAR Revenues = 
CALCULATE( [Budget] , 
    FILTER( Accounts_Table , 
        Accounts_Table[Accounts] = "Revenue" ) )


VAR Expenses = 
CALCULATE( [Budget] , 
    FILTER( Accounts_Table , 
        Accounts_Table[Accounts] = "Expenses" ) )

VAR Result = Revenues - Expenses

RETURN
Result

Step 3: Calculation of Variances Totals i.e. (Revenues and Expenses) -

Variance Totals = [Budgets Totals] - [Actuals Totals]

Step 4: Calculation of % Variance 1 i.e. (Revenues and Expenses) -

% Variance 1 = DIVIDE( [Variance Totals] , [Budgets Totals] , 0 )

Step 5: Calculation of % Variance 2 i.e. (Revenues and Expenses) -

% Variance 2 = 
VAR RevenueVariance = 
CALCULATE( [% Variance 1] , 
    FILTER( Accounts_Table , 
        Accounts_Table[Accounts] = "Revenue" ) )

VAR ExpensesVaraince = 
CALCULATE( [% Variance 1] , 
    FILTER( Accounts_Table , 
        Accounts_Table[Accounts] = "Expenses" ) )

VAR Result = RevenueVariance - ExpensesVaraince

RETURN
Result

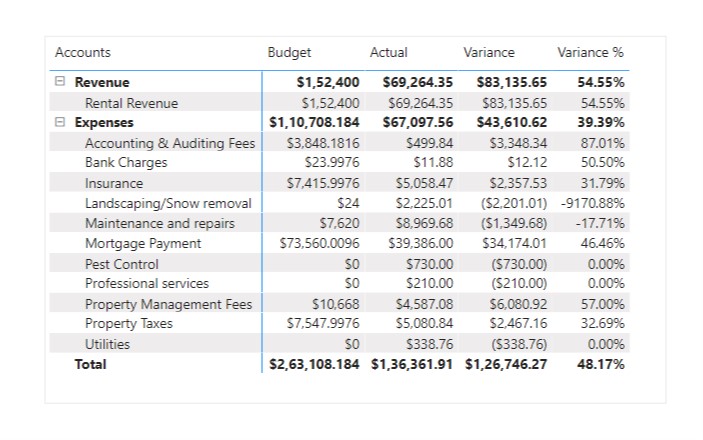
Just a quick note on Step 4 and Step 5 because you might be wondering why two calculation of % Variances. This is because if you follow the general Step 4 to calculate the % Variance will just add up the figures at the Grand Totals.

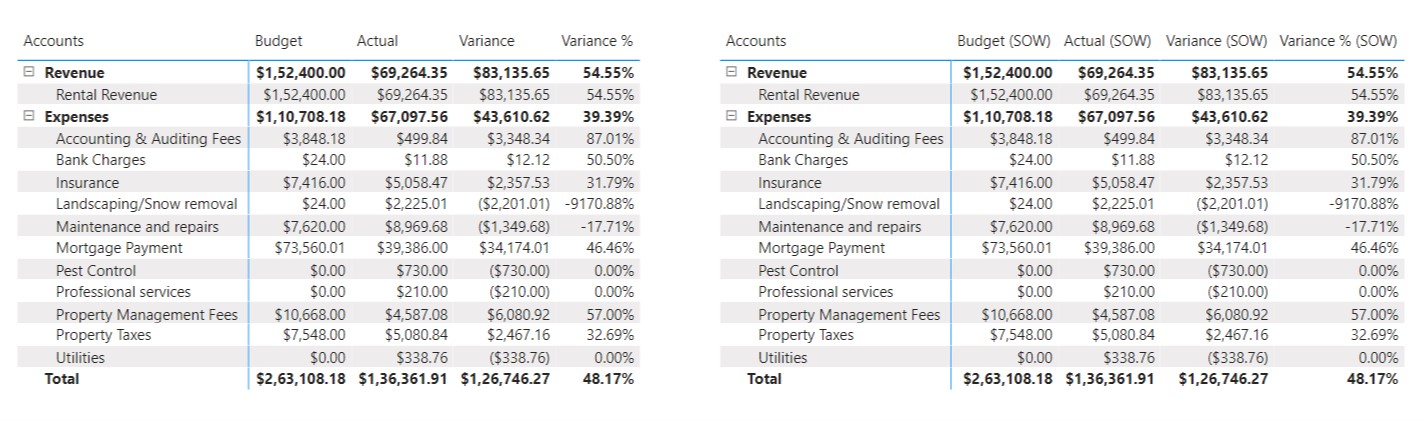
So since we’re talking about the Grand Totals here. I didn’t wanted to left any stone unturned and therefore also calculated another measure just to show the correct total of the % Variance as well.

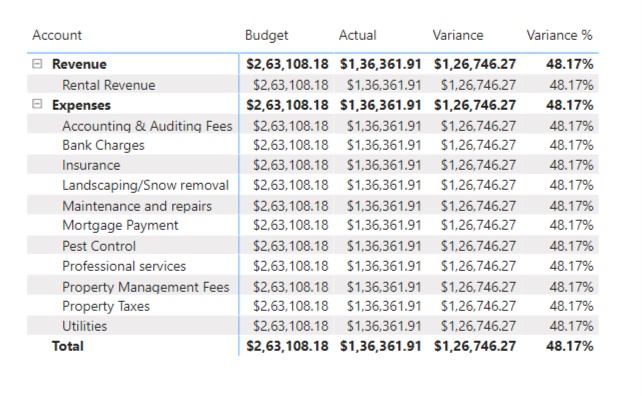
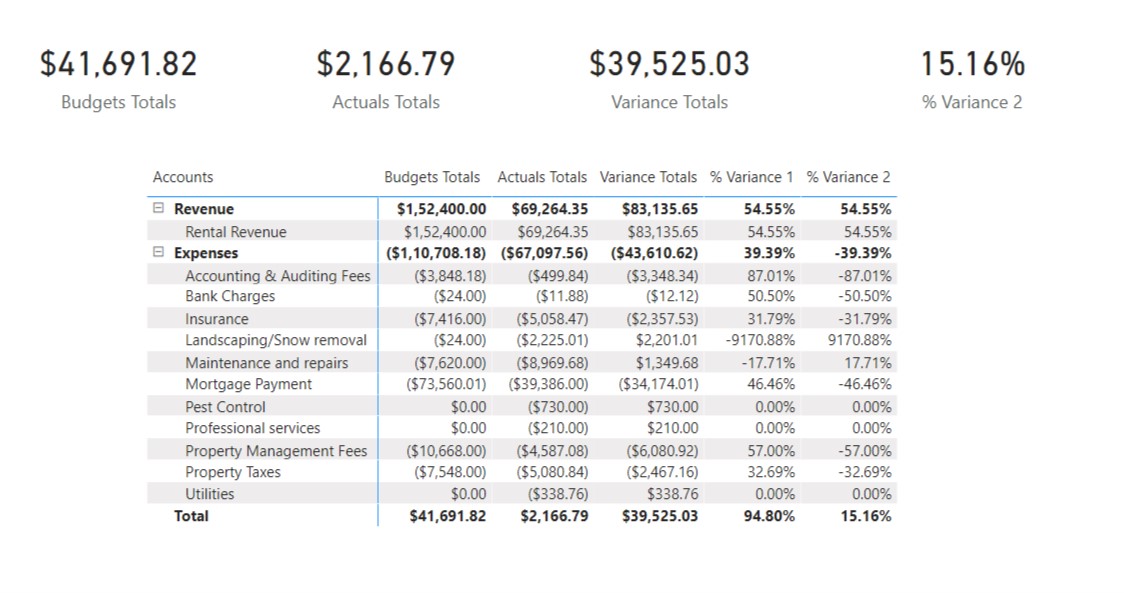
Now, providing the screenshot below of the final results where you can observe the correct grand totals figures -

I’m also attaching the working of the PBIX file for the reference.

Please Note: When you go through the “Financial Reporting” course. All these formulas will start to make sense.

Hoping you find this useful and helps to achieve the desired analysis/results that you’re looking for. :slightly_smiling_face:

Thanks and Warm Regards,
Harsh

HI_Rentals_Budget-to-Actual Report - Harsh v3.pbix (112.3 KB)

2 Likes

This is great stuff, really appreciate it. Just one last question to wrap this up, I asked this before but is it possible to change the “Total” to " Net Income" since total is counterintuitive in this case.

Hello @SonOfWilliam,

Well, yes it’s possible but not with the given format. Because what we’re currently using right now is the default format. That is, just dragging the fields and values and putting them in their relevant sections. So therefore at the end, it’s showing as name “Totals” by default and we don’t the option to edit the “Totals” name. But if you want to have a name as per the desired format as you wish then you’ll be required to create a customized format. As I’ve done in my file. Below is the screenshot provided for the reference -

And all this procedures has been actually well explained in the Financial Reporting course where how you can create your own template and show the figures.

I’m also attaching the working of the PBIX file on “Income Statement” for the reference.

Hoping you’ll find this useful and helps you to achieve your goals. :slightly_smiling_face:

Thanks and Warm Regards,
Harsh

Income Statement - Harsh.pbix (858.6 KB)

Ok, many thanks Harsh. This was amazing and looking forward to taking the relevant courses to know more about this. Cheers.