Budget and seasonality for each Month

Hi Fellow Power BI Users -

Great solution.
Managing-Seasonality in Budget
I don’t have the similar way of data available for monthly weightings. I am trying to automate the seasonality logic in my model by taking the Average sales percentage of the same month for the last 3 years.
Basically, I am trying to use this calculation to calculate the average weighting for the last 3 years by taking the average of the avg daily sales % for each month. Is there any way to do that?

Avg Daily Sales % = DIVIDE([Avg. Sales per Month],[Avg daily sales per FY (all)],0)

This is what I am trying to get.
image

Thanks!

I tried this technique to get to the number but still not getting the right results.

Weightings forcast TY = 
VAR 
AvgSalesPercentageLY = CALCULATE([Avg Daily Sales %], DATEADD('Date'[Date], -1,YEAR))
VAR
AvgSalesPercentage2YearsAgo = CALCULATE([Avg Daily Sales %], DATEADD('Date'[Date], -2,YEAR))
VAR
AvgSalesPercentage3YearsAgo = CALCULATE([Avg Daily Sales %], DATEADD('Date'[Date], -3,YEAR))
Return
DIVIDE(AvgSalesPercentageLY + AvgSalesPercentage2YearsAgo + AvgSalesPercentage3YearsAgo, 3, 0)

What does you model look like? And how are you attempting to showcase the results?

Are you completing this in a calculated column?

Is your formula connected to a date table? It won’t work otherwise because of the DATEADD function you are using needs it to be

I am trying to create a separate table with month names and calculated column (weightings calculation).

Yes, my formula (information coming from my sales table) is connected to a date table.

I’m going to need to see more around what your model looks like and exactly what you are looking to show on your report here.

It’s still not clear sorry. Thanks

Hi Sam,
Please ignore this request. I have figured it out.

Thanks,

Kiran

Ok thanks for letting me know.

Can you round off your post with the solution to help others.

Thanks

Sure.

I am sure it’s not the best way to do this but it’s easier to validate.
Percentage of average sales for Last Year

1st -

AvgSales LY = 
    Var AvgSales = DIVIDE([Total Sales LY], [Work days LY])
    Return
    IF(HASONEVALUE('Date'[Short Month]), AvgSales, SUMX(VALUES('Date'[Short Month]), AvgSales))

2nd -
AvgSales LY (ALL) = CALCULATE([AvgSales LY], ALLEXCEPT('Date','Date'[Fiscal Year]))

3rd -
Sales Seasonality Trend for LY = DIVIDE([AvgSales LY], [AvgSales LY (ALL)])

Percentage of average sales for 2 Years Ago
1st -
AvgSales 2YearsAgo = CALCULATE([AvgSales LY], SAMEPERIODLASTYEAR('Date'[Date]))

2nd -
AvgSales 2YearsAgo (ALL) = CALCULATE([AvgSales 2YearsAgo], ALLEXCEPT('Date','Date'[Fiscal Year]))
3rd -
Sales Seasonality Trend for 2YeasAgo = DIVIDE([AvgSales 2YearsAgo], [AvgSales 2YearsAgo (ALL)])

Percentage of Average sales 3 Years Ago
1st -
AvgSales 3YearsAgo = CALCULATE([AvgSales 2YearsAgo], SAMEPERIODLASTYEAR('Date'[Date]))

2nd
AvgSales 3YearsAgo (ALL) = CALCULATE([AvgSales 3YearsAgo], ALLEXCEPT('Date','Date'[Fiscal Year]))
3rd
Sales Seasonality Trend for 3YeasAgo = DIVIDE([AvgSales 3YearsAgo], [AvgSales 3YearsAgo (ALL)])

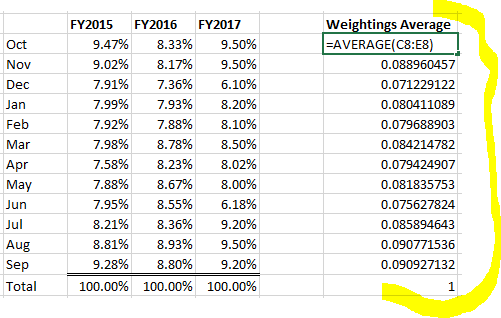
In the end, I added all three values and divided with 3. It gives me the results I was looking for.
DIVIDE([Sales Seasonality Trend for LY] + [Sales Seasonality Trend for 2YeasAgo] + [Sales Seasonality Trend for 3YeasAgo], 3,0)

image