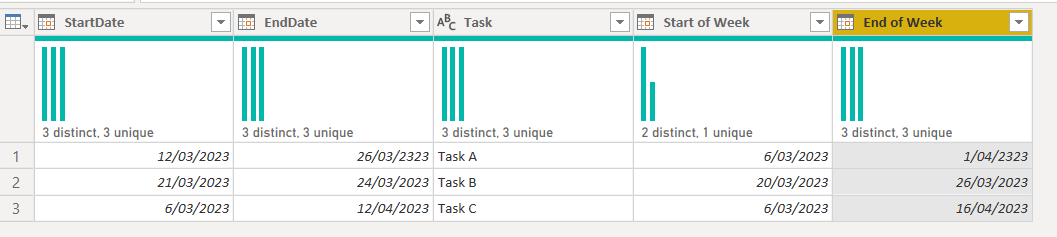
I have one issue and I am not sure how to solve this. I want to create a Gantt chart to show the start and end of the task. The user wants to see reports on a weekly basis. In the below picture, if I apply a filter on the week starting on 20/03/2023(2nd record), it will drop off the other 2 records(1&3) although those records are still in progress during this week.
I think it will work if I am able to split first row into 4 rows where everything remains the same except for start of week where it should show start of week as (06/03, 13/03,20/03,27/03) etc. Is it possible in Power query?
Thank you for your response. Unfortunately, I can not use end of week as it will cause same issue. For example if I apply filter on End of week(26-03-2023), it will filter out only 1 record although first record appears within the same range.
ok. i think if you use the EDNA date table you should be able to get the information that you need. Your file doesn’t have a date table. (make sure you mark it as date table.
Best practice is always have a date table in your powerbi file.
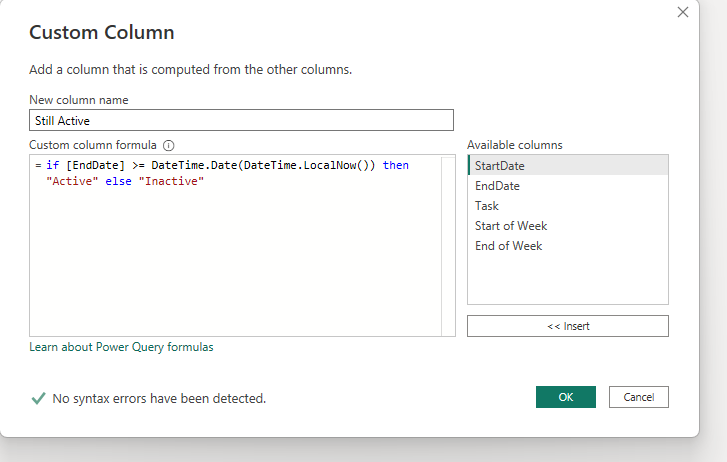
would it make sense to add a custom column that would show if the Task is still active and you could use that as a filter?
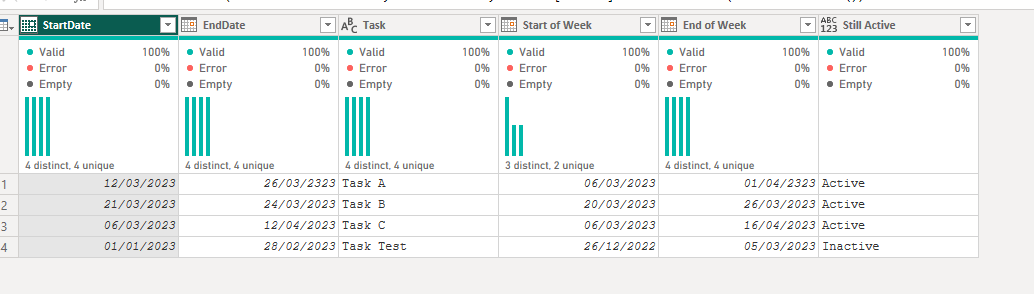
I created a custom column that looks at the End Date and if the End Date is greater than and/or equal to today then it is classed as Active, otherwise it is classed as Inactive.
So, you can use the Still Active column/flag to only have items that are still open. Does this solve your issue?
There are a couple of solutions you could try to this problem:
Add an “Active/Inactive” status column to your data: You can add a new column to your data that indicates whether a task is active or inactive during a certain week. For example, if a task starts on week 1 and ends on week 4, it would be active during weeks 1-4, and inactive during weeks 5 and beyond. You can use this column to filter out inactive tasks when viewing the chart for a specific week.
Use the week number of the end date: Another solution is to use the week number of the end date instead of the start date. This way, tasks that end during the filtered week will still be visible in the chart. You can create a new column with the week number of the end date using the formula "= Date.WeekOfYear([EndDate])
Due to inactivity, a response on this post has been tagged as “Solution”.
If you have a follow question or concern related to this topic, please remove the Solution tag first by clicking the three dots beside Reply and then untick the check box.