Hello
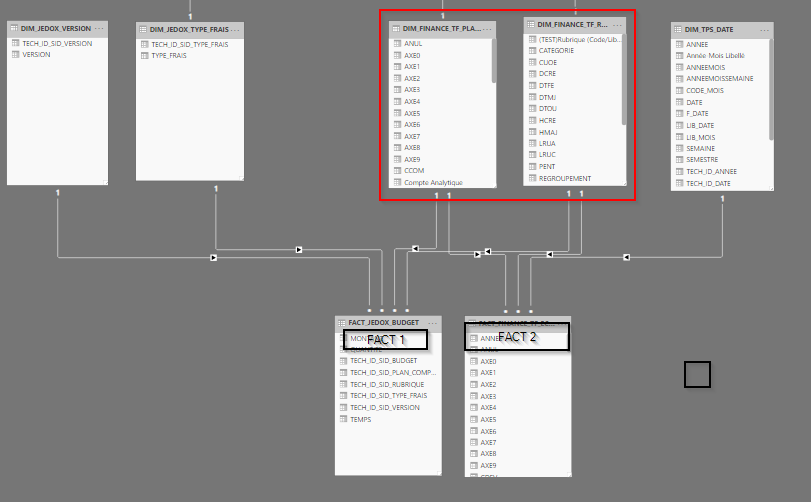
Below is my original model
Fact 1 - (Budget table)
The budget table is joined to my Date table via a virtual relationship (as shown in course video) . The granularity is by month
Fact 2 (Account entry table)
Both tables share the two dimensions (with red square around them) and the date table The two dimension tables to the left are only linked to the Budget table.
With this model in place, I added selected columns from the all four dimensions including the MonthYear column from the date table to a table visual. The measure is coming from Fact #2 table.
Problem : I had double entries showing when the columns from the left two dimensions (linked to Fact 1) were selected. I thought that because both tables were sharing 3 dimensions, I could still be able have additional dimensions added that are not “shared” between the two.
Am I missing something or is it that all dimensions must be “shared” inorder for PowerBI to drillacross the two fact tables and show the correct results?
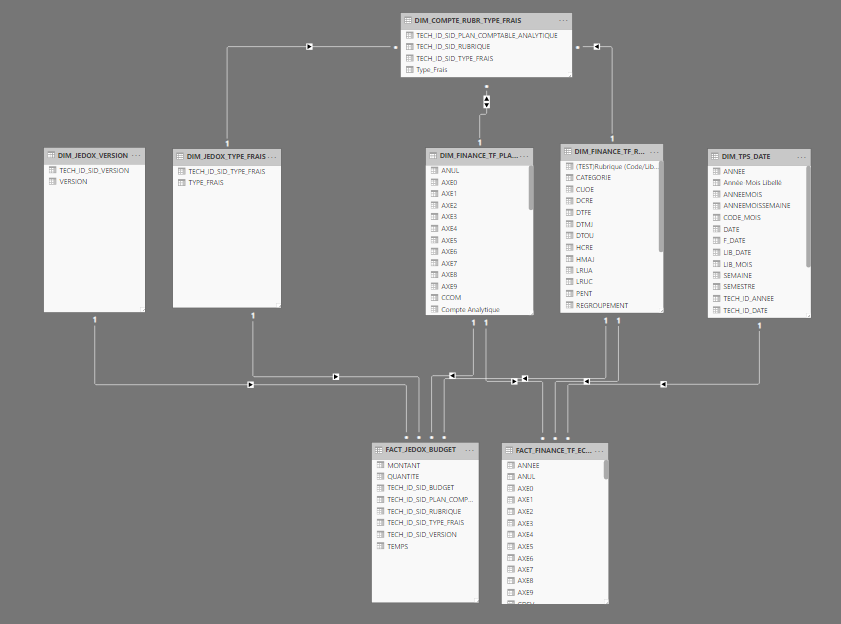
With incorrect results, I ended up redoing my model by adding a bridge table - the one on the top) Screenshot below. Now the results are filtering correctly.
Question : Do I need to add a bridge table (and change the relationship direction to bi-directionaly for one of the dimensions) for PowerBI to filter across the two fact tables correctly? Do all dimensions need to be shared between the two fact tables inorder for the results to show correctly?
Thanks

