I am trying to add a secondary data point/reference/target line to boxplot/whsker visual (from MAQ software custom visual),But i could not do so,
Is there any alternative to do this.Hope deneb can help on this.
WIP pbix/data sheet is attached. 2023-09-16T18:30:00Z
Thanks
Deneb is so customizable, just about anything is possible, so clear requirements are necessary. Unfortunately, your desired outcome is not clear. Please create and upload a mock-up of your desired outcome (perhaps a marked-up screenshot of the MAQ visual or a PowerPoint or Excel starting point).
Here’s a shell of a possible Deneb solution using the out-of-the-box Vega-Lite boxplot mark:
(For this example, I’ve used a simple calculation to make-up values for the “reference line”.)
I’m not sure what you mean by “dataset 1” and “dataset 2”, as with Deneb (and to my understanding for all custom visuals), Power BI can only supply a single dataset. Further, all 4 boxplots look identical as the data is identical; here’s a simple repositioning of the data from your PBIX: boxplot_data.xlsx (15.5 KB)
If you’d like to pursue further, please include an explanation of what the “Dynamic value marker from dataset 2” is supposed to represent, and create an up-to-date PBIX file with the data as you’d like to see it (in a table).
Hi @Greg Thank you very much for the effort you are giving on this.
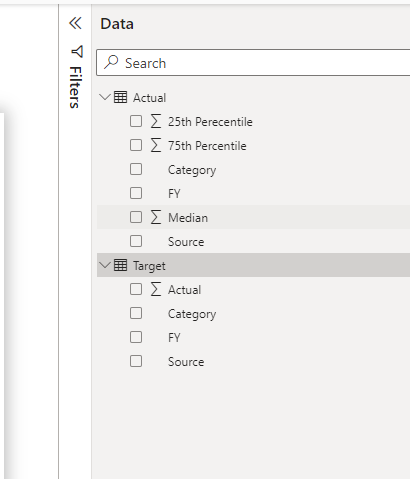
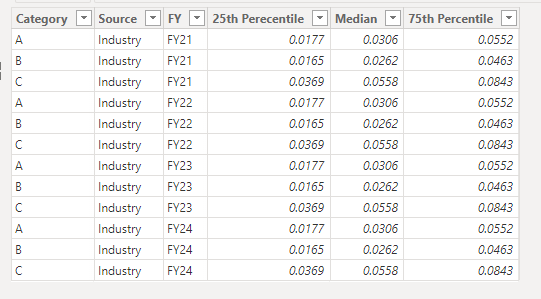
To summarize in PBI i have uploaded two datasets.(Actual and Target)
Actual is having the pivoted/summarized information of percentiles without Lowest and highest).Detailed data would not getting ,we are getting already calculated percentiles.No need to calculate percentiles in PowerBI again.
(In MAQ custom visual i could not find a way to generate the visual with pre-aggregated percentiles.)
Target sheet is having the information which is needed to add as reference lines .This information(both target,actual) is also dynamic ,values change monthly.structure same. Target data is changed on company and year,not on product
Actual data should be filtered based on slicers,while reference data should not be filtered when sliced.
i am sorry for not giving enough clarity on this.Have attached the pbix file with amended dataset. eDNA Forum - Deneb Boxplot.pbix (1.8 MB)
OK, I took a look at your revised PBIX, but can’t see a way forward: the whole point of the boxplot mark in Deneb is to process detailed data and automatically generate the various statistics (25th, median, 75th, etc.). I don’t see how it could be used to provide value on pre-aggregated data.
I’m guessing that a standard Power BI visual (say, a line and clustered column chart) may provide you with what you’re looking for. Deneb could certainly be used to create a column chart, with layers of tick marks added for the 25th, median, 75, and a layer of a rule mark for the target.
(For a Deneb visual, I’d probably start with this [or use the facet/spec syntax from my first try at your issue]:
Vega-Lite has an example of a box plot with pre-calculated summaries in their doc: Box Plot | Vega-Lite (bottom of the page in case the anchor link doesn’t work), which essentially gives you the primitive marks required to do this.
A boxplot mark is actually a composite mark, that V-L does on your behalf).
You’d add the measure to the dataset and add a line mark for it, so yes you can. If your dataset has multiple rows, you may want to filter that layer down to the first row so that you don’t plot multiple marks for the same value, which you can do with a window function such as row_number and then filter where this value == 1, or you could create a param and extract this using an expression, e.g. data('dataset')[0]['my_measure'].