Hello @christina.weber,
Thank You for posting your query onto the Forum.
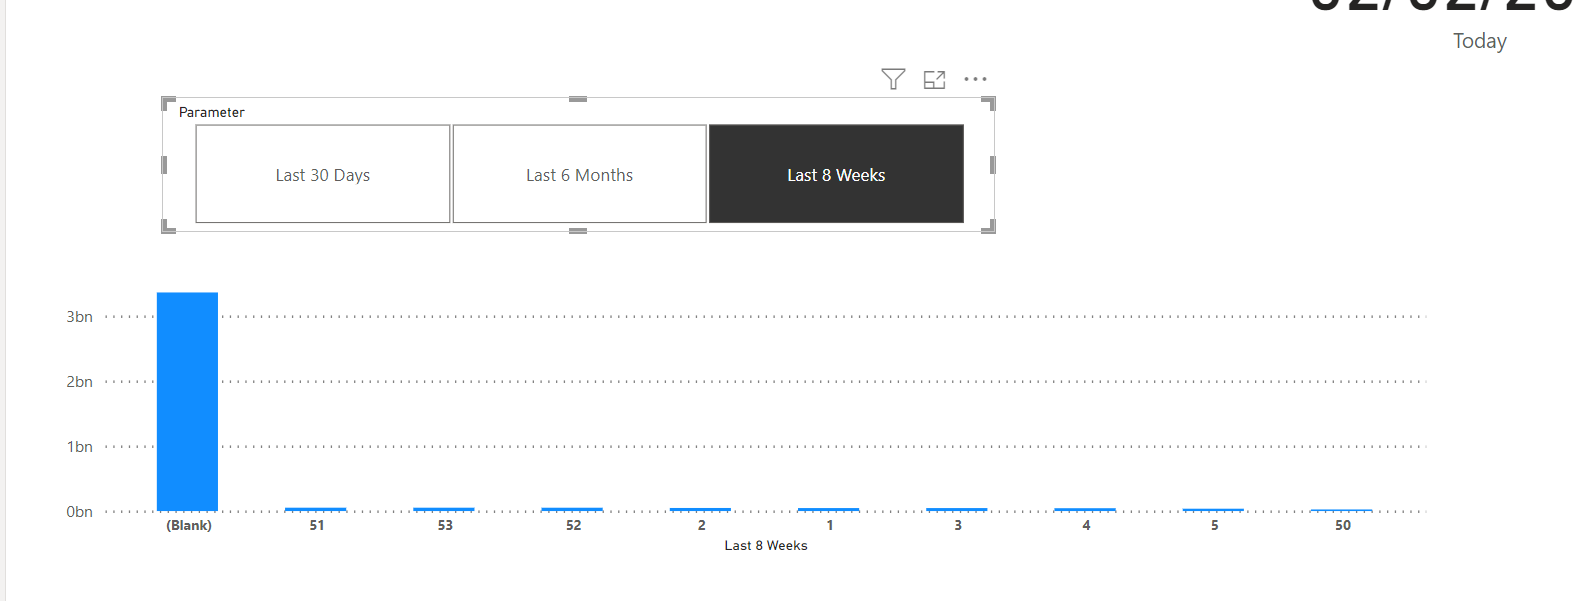
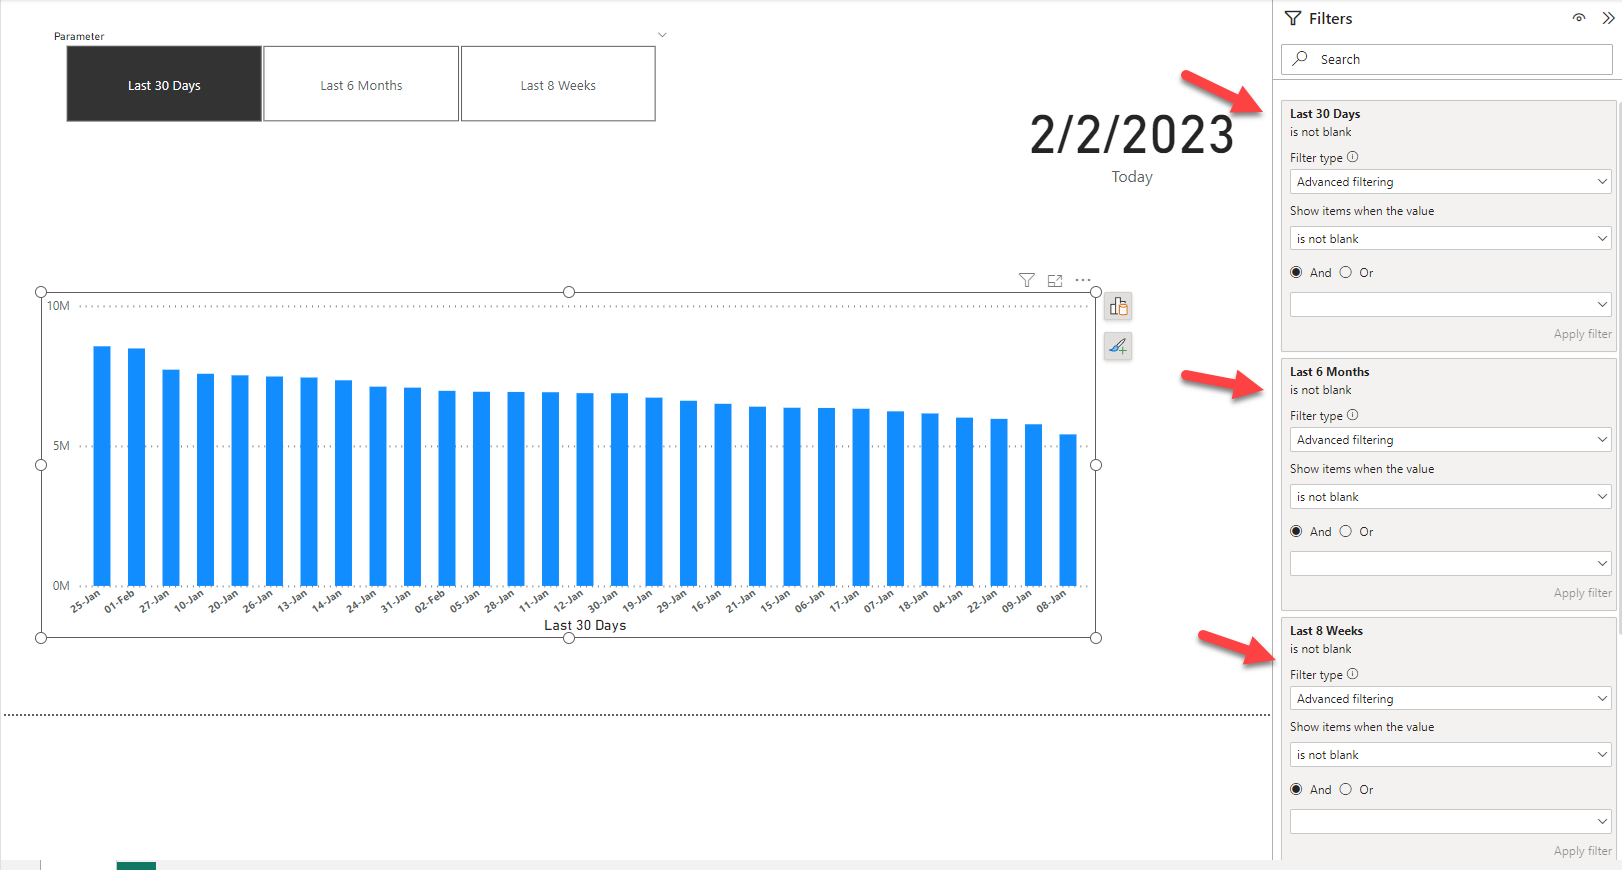
You cannot remove blanks using the Filter Pane option without having a direct effect over another visual since those 3 fields are coming from the same Date table and that too, they’re of different magnitudes i.e., Last 30 Days, Last 6 Months and Last 8 Weeks.
Therefore, in order to achieve the results, you’ll be required to write 3 different measures rather than creating 3 different calculated columns in the Date table. Below are the measures provided -
Salary L30D =
VAR _Max_Date =
CALCULATE( MAX( data[Date] ) ,
    ALL( data ) )

VAR _Last_30th_Day_Date =
DATE(
    YEAR( _Max_Date ) ,
    MONTH( _Max_Date ) ,
    DAY( _Max_Date ) - 29 )

VAR _Results =
CALCULATE( SUM( data[salary] ) ,
    FILTER( ALL( data[Date] ) ,
        data[Date] >= _Last_30th_Day_Date &&
        data[Date] <= _Max_Date ) )

RETURN
_Results
Salary L6M =
VAR _Max_Date =
CALCULATE( MAX( data[Date] ) ,
    ALL( data ) )

VAR _Last_6th_Month_Date =
DATE(
    YEAR( _Max_Date ) ,
    MONTH( _Max_Date ) ,
    DAY( _Max_Date ) - 183 )

VAR _Results =
CALCULATE( SUM( data[salary] ) ,
    FILTER( ALL( data[Date] ) ,
        data[Date] >= _Last_6th_Month_Date &&
        data[Date] <= _Max_Date ) )

RETURN
_Results
Salary L8W =
VAR _Max_Date =
CALCULATE( MAX( data[Date] ) ,
    ALL( data ) )

VAR _Last_8th_Week_Date =
DATE(
    YEAR( _Max_Date ) ,
    MONTH( _Max_Date ) ,
    DAY( _Max_Date ) - 56 )

VAR _Results =
CALCULATE( SUM( data[salary] ) ,
    FILTER( ALL( data[Date] ) ,
        data[Date] >= _Last_8th_Week_Date &&
        data[Date] <= _Max_Date ) )

RETURN
_Results
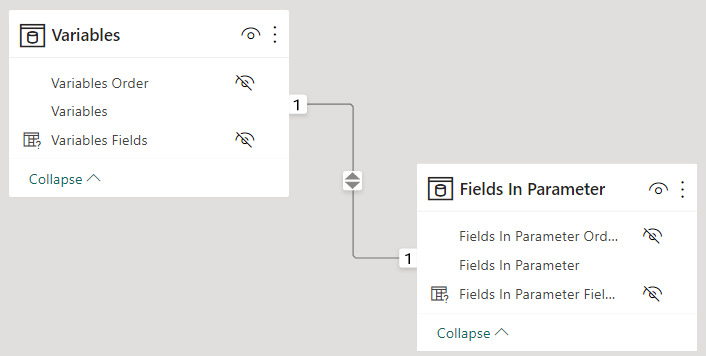
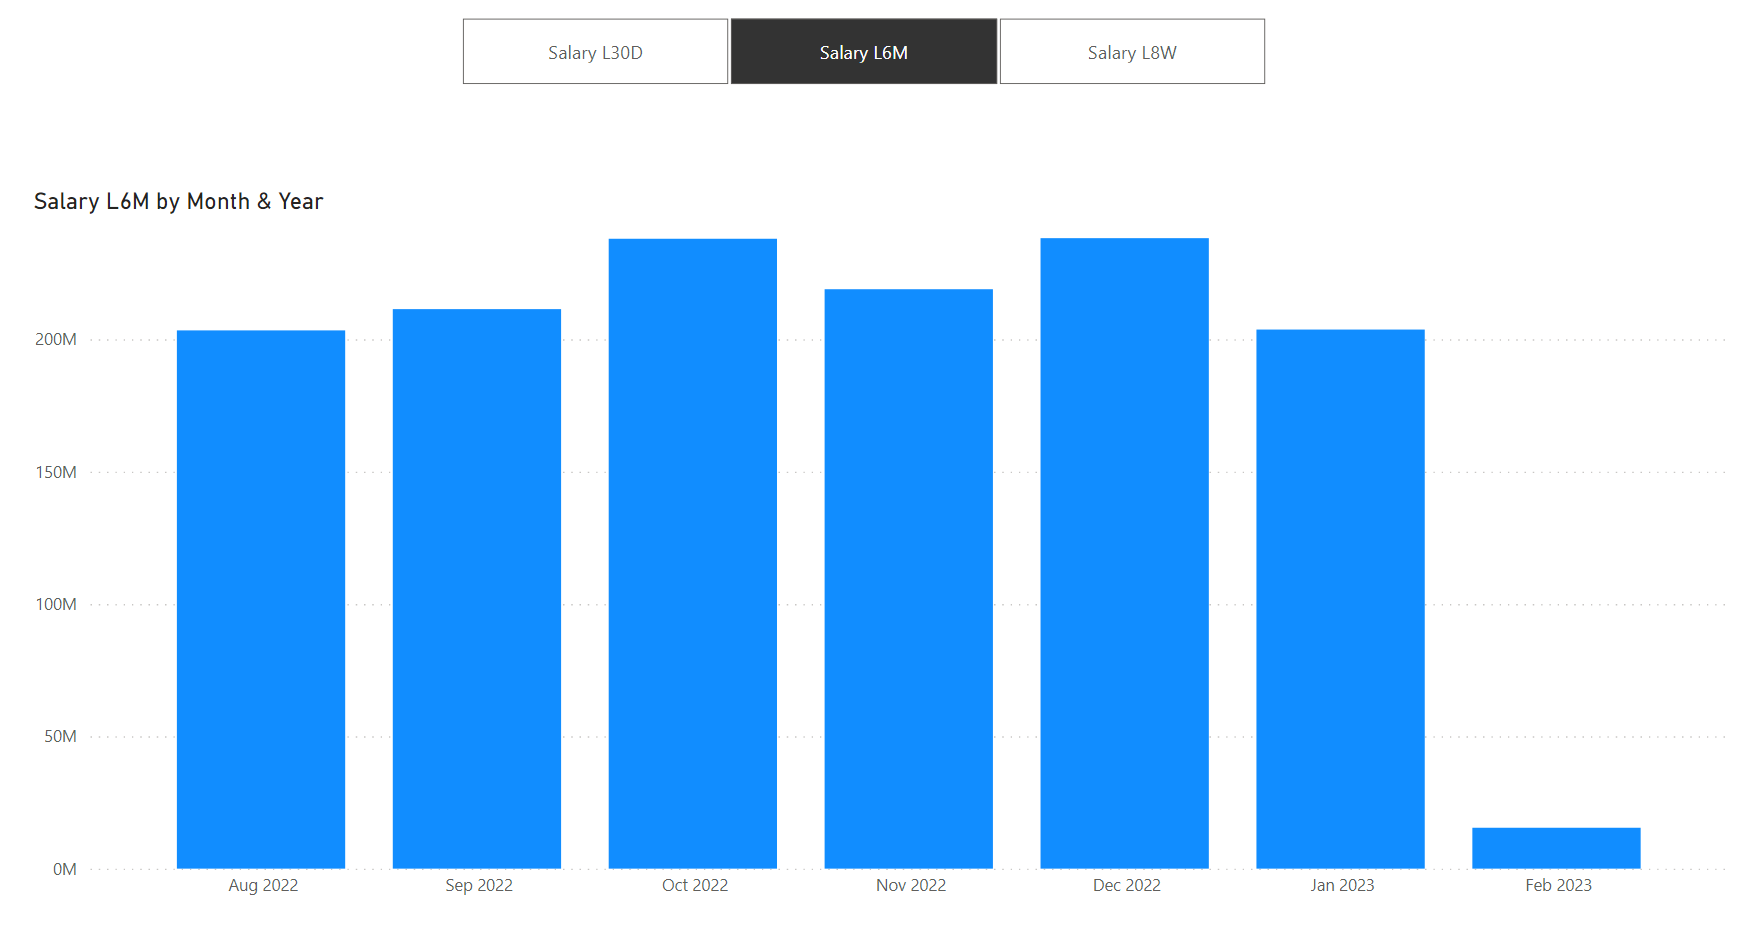
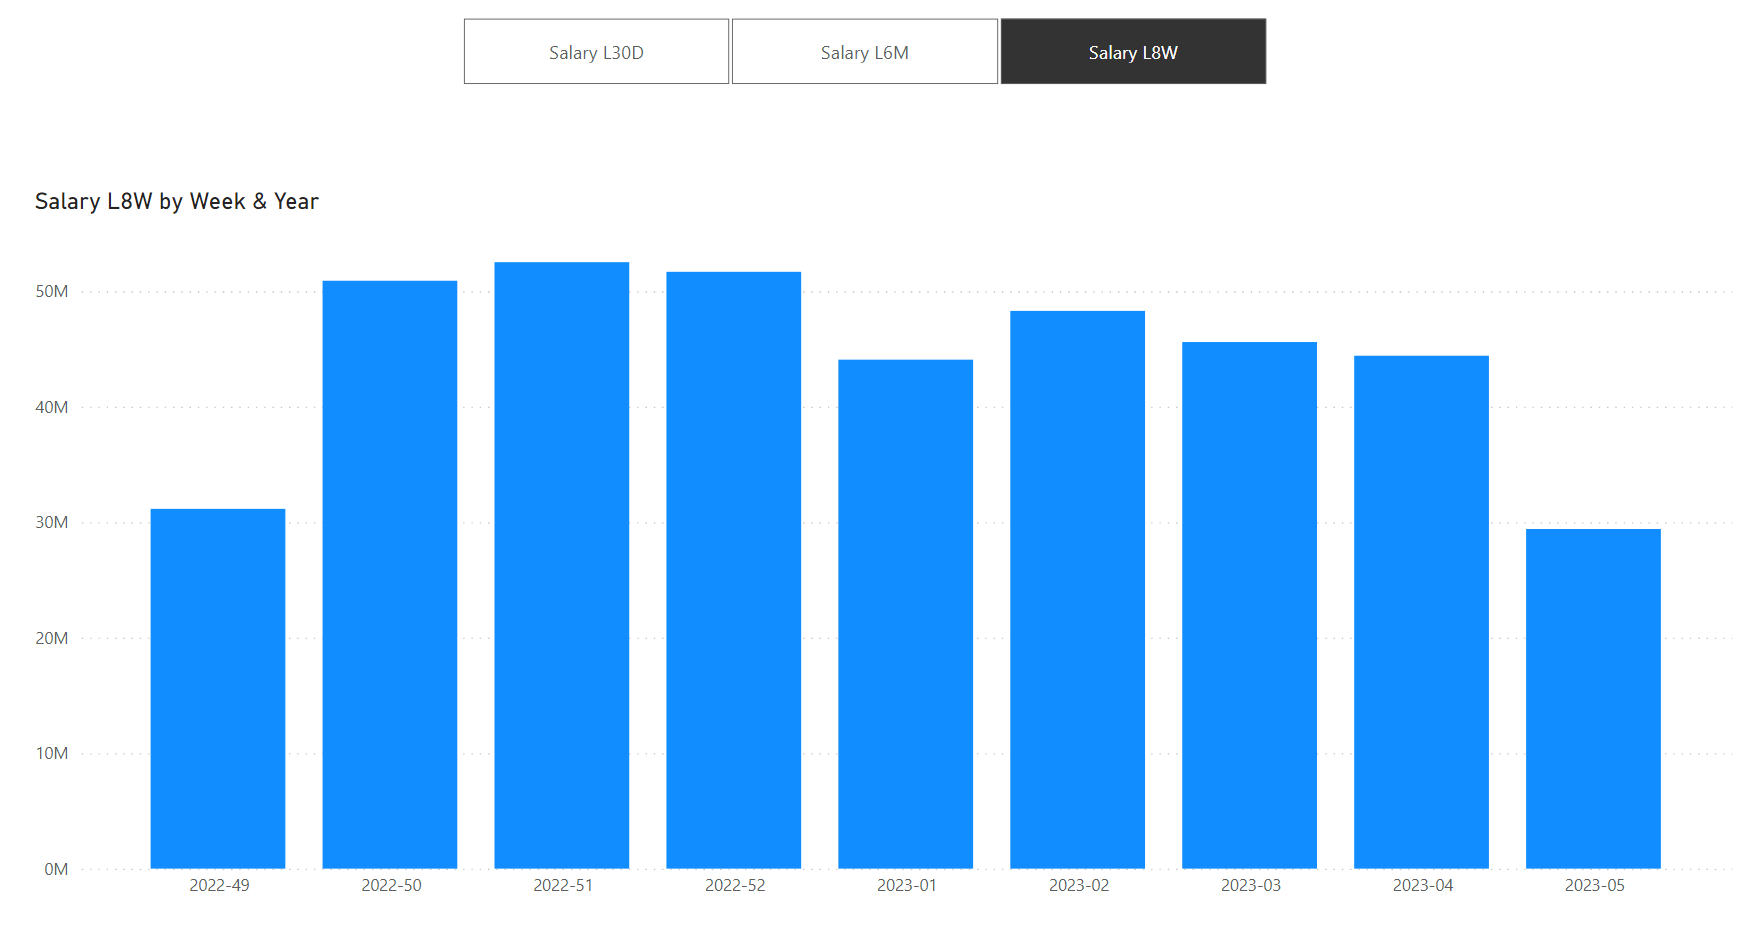
Now, create two field parameters. One field parameters will contain these 3 measures and the other one will contain the actual fields/columns i.e., for Last 30 Days, the field will be Dates. For Last 6 Months, it’ll be Month & Year and for Last 8 Weeks, the field will be Week & Year.
So, now against those 3 measures, you’ve 3 fields as well. And hence, create a “One-to-One” relationship between the two field parameters. This is how it’ll look like -
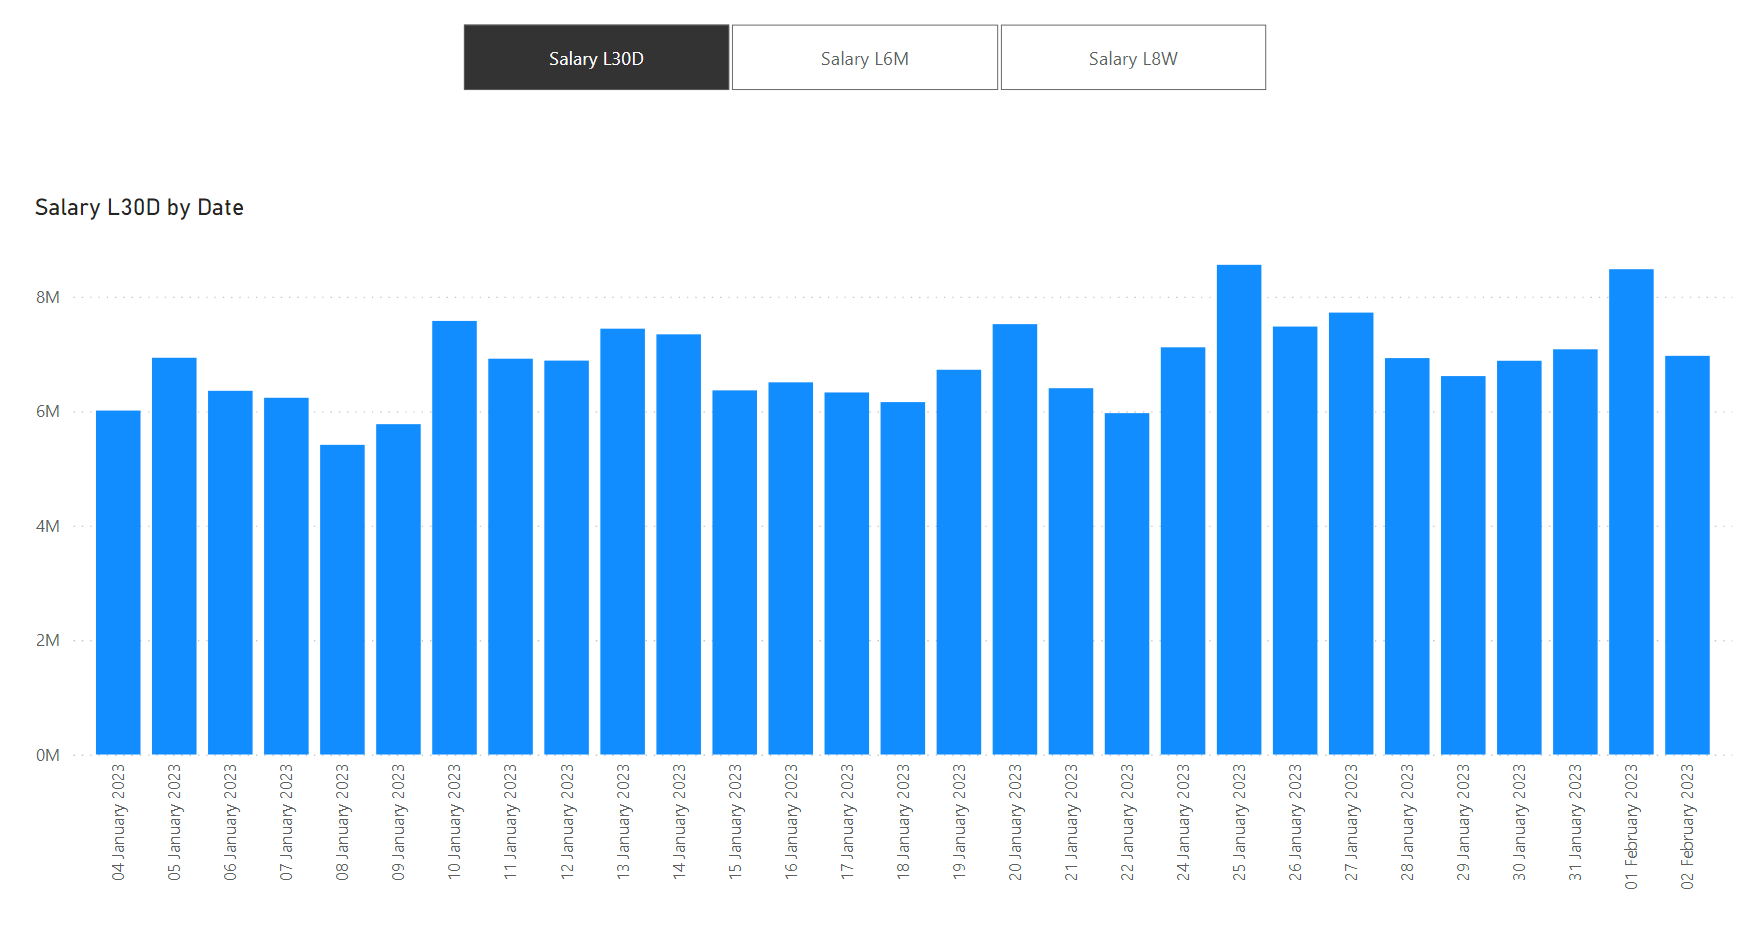
Finally, place the field “Fields In Parameter” onto the X-axis of the chart and on the Y-axis place the “Variables”. So, now when you switch between the parameters, you’ll see the results as expected and not any blanks. Below are the screenshot provided -
I’m also attaching the working of the PBIX file for the reference purposes.
Hoping you find this useful and meets your requirements that you’ve been looking for.
Thanks and Warm Regards,
Harsh
Sample_Blank Parameter - Harsh.pbix (136.6 KB)