Best way to optimize data model with intermediate tables

Hi everyone.
I’m working my way through the different courses and try to optimize the report I’m creating along the way. The report will essentially be for the entire company so I want to implement as many best practices as I can along the way. So far, the report has data about all orders (blue) as well as invoiced sales (green).

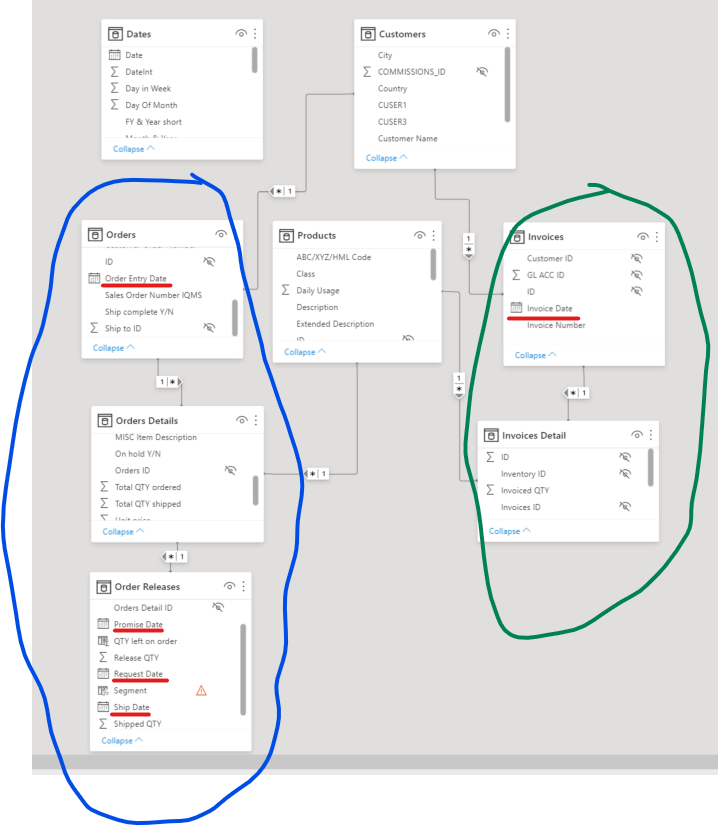
As you can see, the tables in our system have some kind of hierarchy. There is usually some kind of header table holding the general information and then there is a detailed table holding the details on an line item level. For the backlog, there is an additional table that holds the information about each release for the data on the item level. For the invoiced sales, it is only two levels but still the same thing. In addition, important dates for my time intelligence are spread over multiple tables. (Date relations not setup yet)

What I learned so far regarding best practices for the data model, this is not a best practice model. If necessary, I would like to have clear fact and lookup tables.

My main questions are:

  • Is there a video in the courses regarding this issue? I am somewhat overwhelmed by the amount of videos there are and I’m not clear where to look for a solution.

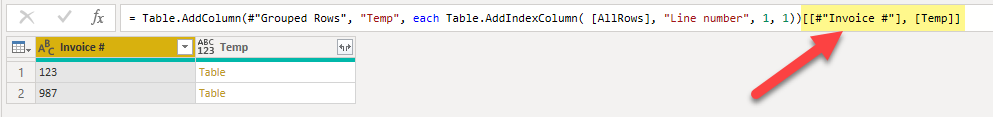
  • What is the best way to consolidate? I could think of merging queries, but merging the queries makes updates and changes to the data source very slow and is kind of a pain if I want to scale up.

It would be great if I can get pointed into the right direction how to get there.

Thank you very much.
Nico

Hi @nico, we aim to consistently improve the topics being posted on the forum to help you in getting a strong solution faster. While waiting for a response, here are some tips so you can get the most out of the forum and other Enterprise DNA resources.

  • Use the forum search to discover if your query has been asked before by another member.
  • When posting a topic with formula make sure that it is correctly formatted to preformatted text </>.

image

  • Use the proper category that best describes your topic
  • Provide as much context to a question as possible.
  • Include the masked demo pbix file, screenshot of the data model, details of how you want to visualize a result, and any other supporting links and details.

I also suggest that you check the forum guideline How To Use The Enterprise DNA Support Forum. Not adhering to it may sometimes cause delay in getting an answer.

Please also check the How To Mask Sensitive Data thread for some tips on how to mask your pbix file.

Hi @nico
I’ve been dealing with your problem for about a year in my job.
I have used many techniques but finally, I found a solution that I like to share with you.

  • First, you need to define a new column in “Invoices Details” table that ranks “invoice details items” for each invoice. For instance, if you have 3 invoice details for a specific invoice, this column would rank them 1,2, and 3. By doing so, you will create a somehow index column that is very useful for the future calculation.
  • After that, you can merge the “Invoices” and “Invoices Details” tables, and write all your DAX queries based on the resulted table.

Note: Whenever you need to calculate sth which needs you to consider each invoice only one time, you can use the new column you created at the first step. For instance, if you want to count the number of invoices - without having invoice numbers - you can use the following formula:

COUNTROWS(
Filter( ‘Merged Table’ , Merged Table [INDEX COLUMN] = 1 ) )

It was just an example, which I hope would help you understand the concept behind creating the index column.

It was just my experience and I hope would be useful
Best :slight_smile:

Thanks @sedhosen

I do understand the idea behind that. How do you rank the invoices? Do you do this in the transformation section or do you do it with a calculated column in DAX and later merge the queries?
I will try to think about it a little more, but your explanation makes sense.

Nico

Dear @nico,

Since my database was in excel format, I used the “SUMPRODUCT” function in excel to rank the items within each invoice. Unfortunately, I don’t know how to do this in power query OR DAX, but surely there should be a way for doing this in power bi too.

For doing it in excel, this link tells you all the details you need:
https://trumpexcel.com/rank-within-groups-excel/

After ranking the items in the “Invoices Details” Sheet, I imported the data to Power BI and then merged “Invoices” and “Invoices Details” sheets based on the invoice number or invoice ID.

I hope it would be helpful :slight_smile:

Hi @nico,

If line numbers aren’t available in the datasource, they are easy to create in Power Query, just add an Index column. Here are the basic steps:

Group by the Invoice key and select the option “All Rows”

Add an Index to the nested table by adding a custom column.

Only keep the Invoice key and Updated nested table column

Finally with the sideward arrows extract the data.
image

.

Here’s a sample script, just paste that into a new blank query

let
    Source = Table.FromRows(Json.Document(Binary.Decompress(Binary.FromText("i45WMjQyVtJR8ixJzVUwVIrVQREwQhcwBgtYWpijakESAGqJBQA=", BinaryEncoding.Base64), Compression.Deflate)), let _t = ((type nullable text) meta [Serialized.Text = true]) in type table [#"Invoice #" = _t, #"Line item" = _t]),
    #"Grouped Rows" = Table.Group(Source, {"Invoice #"}, {{"AllRows", each _, type table [#"Invoice #"=nullable text, Line item=nullable text]}}),
    #"Added Custom" = Table.AddColumn(#"Grouped Rows", "Temp", each Table.AddIndexColumn( [AllRows], "Line number", 1, 1))[[#"Invoice #"], [Temp]],
    #"Expanded Temp" = Table.ExpandTableColumn(#"Added Custom", "Temp", {"Line item", "Line number"}, {"Line item", "Line number"}),
    #"Changed Type" = Table.TransformColumnTypes(#"Expanded Temp",{{"Line item", type text}, {"Line number", Int64.Type}})
in
    #"Changed Type"

.

Merging with the Invoice Header is optional, if performance wise it’s acceptable - that’s great otherwise don’t. I hope this is helpful.

2 Likes

Hi @Melissa,
Thank you so much for this explanation. It works great.

I do have two follow up questions though.

  1. Why do I need to keep the Inovice # column? When I expand the Temp table, the invoice number is included so I get that ID twice. Could I also just remove the first column or should I just not expand the the field in the Temp table?

  1. Regarding your comment about merging being optional. The reason why I want to do the index is part is part of merging the two table (although I don’t think the index is necessary). So do you think the merging would not be necessary at all? What would be your suggestion to do if you have these header and detail tables like I do?

Thanks again.
Nico

Hi @nico,

  1. You don’t - forgot to disable that, when I re-read the post and saw that - I updated it, you must have copied it just before I amended it. Apologies, if you copy the script again it is resolved.
  2. Personally I always try to create a star-schema. That means - if at all possible I’ll choose to merge Header and Details. However you mentioned performance issues and if that is a real concern a snowflake schema will work just as well.

I hope this is helpful.

1 Like

Hi @Melissa

Thank you so much. This is perfect.
I had performance issues with the old way how I transformed the data model in various mixed (and messy) steps and it took sometimes quite a while to update or to make changes.
I changed my data transformation and data model to follow the best practices while going through the superuser workshop.
This increased speed significantly and it is so fast now that merging the queries is not a problem at all.
Again thanks a lot for you help (and also @sedhosen).
Nico

2 Likes