I won’t add my PBIX file for this one as it’s more of a logical question that I am hoping for some help with please
I am looking at data from a ticketing system, within this I have a ticket created date and ticket completed date
I also have a date table.
I understand that I can create active and inactive relationships between both of the ticket date values, and connect these to the date table.
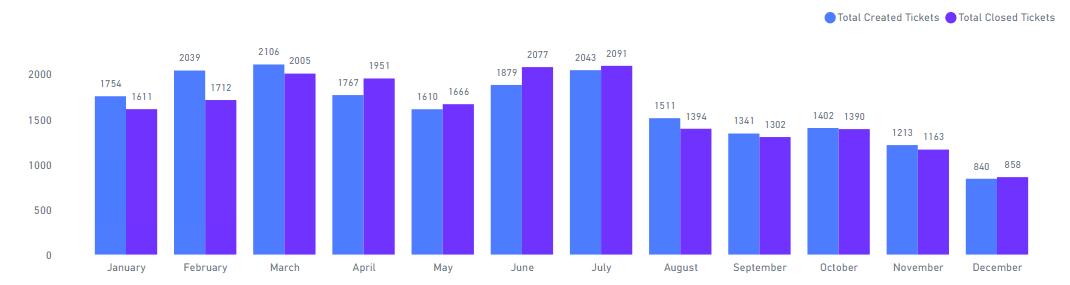
My question is, if I want to create a bar chart showing my total tickets created each month, and total tickets closed each month (irrespective of when they were created), what should I use as my X-Axis?
My concern is that if X-Axis uses the Month column from my date table, it will be referencing the active relationship, meaning if I have an active relationship between the date table and ticket completed date, it would only show me the created tickets which were also completed in that month, which would be the incorrect data.
Or, should both my date relationships be inactive and I USERELATIONSHIP and create some sort of measure?
Or is it something else and am I missing something really obvious?
I hope this makes sense, however happy to provide additional clarification if necessary.
By default, when we drag the date field from the date table, it’ll showcase the results based on the active relationship which has been created. But if you want to analyze the results based on another date field i.e., in your case, “ticket completed date” then create a measure using the “USERELATIONSHIP()” function which will activate the relationship virtually and then the date field will showcase the results accordingly.
I’m attaching the working of the example PBIX file for the reference purposes showcasing the results based on two different dates accordingly.
Hoping you find this useful and meets your requirements that you’ve been looking for.
So just to confirm what I have now done, both of my relationships are set to inactive and I have created two measures which use USERELATIONSHIP - one called Total Tickets Created, one called Total Tickets Closed.
On my bar chart, I have used Month from my Date table on the X-axis, this should hopefully allow me to view both values side by side in one chart without it secretly using the active relationship for my month value.
I’d caution you against not having an active relationship to your date table. Once you start adding in other metrics to your report, your end users will change the date filters or slicers and wonder why things aren’t changing. In our org, customer satisfaction reports are based on when the case was closed, most other reports are based on when the case was created, so any of the main calculations don’t have to be wrapped in a calculate([blah],(userelationship()) for every single measure written, and all our analysts know that.
You can test if this works in your model by making one of the relationships active, and deleting the userelationship clause from one of the 2 measures. Your bar chart shouldn’t break.