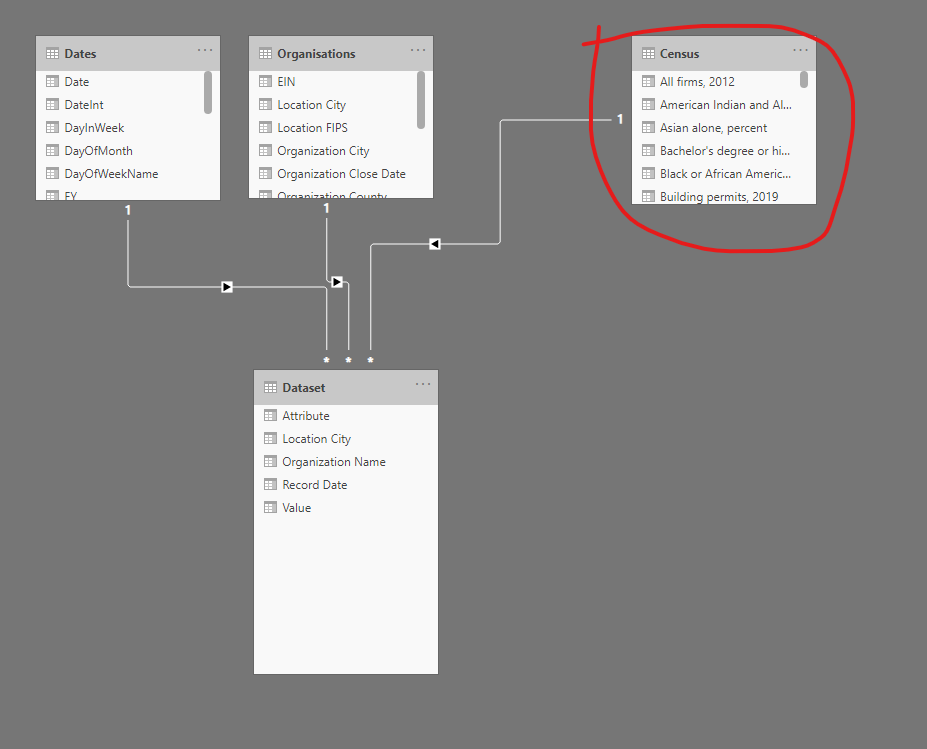
I am struggling to understand what is the best practice and approach in setting up data model to to compare locations for organisations (customers) in fact table with census data or any other matrix e.g. budgets. All census attributes in census table are saved in columns and each record represent information for a given organisation. Organisation name is the unique id linking the relationships. I can not unpivot census attributes in the following model as that will leave me with no unique column in census table:
Following is sample of my relationships with census table set as a dimensions table:
Should such a table should better be treated as a an additional fact table(s)? Are there relevant tutorials that may help me understand the underlying concept?
1. Dataset has values for several attributes for a given organisation for each month
2. I duplicated the data set to extract information for 'organisations' and 'locations' dimension tables.

• I am wondering should better have locations table as a dimension to organisations table. Is it possible or ok to have dimension of a dimension table? I am wondering on this because each organisation can have their offices in more than one location. Is the above

3. Then I have a separate excel file with census information for the locations where a group of organisations operate in.
4. I have created this as a dimensions table to main dataset fact table.
5. I want to be able to compare the census matrices with the data in main table. You may check a few visualisations I made.
Hi @ahmed9s, we’ve noticed that no response has been received from you since the 31st of July. We just want to check if you still need further help with this post? In case there won’t be any activity on it in the next few days, we’ll be tagging this post as Solved. If you have a follow question or concern related to this topic, please remove the Solution tag first by clicking the three dots beside Reply and then untick the checkbox. Thanks!
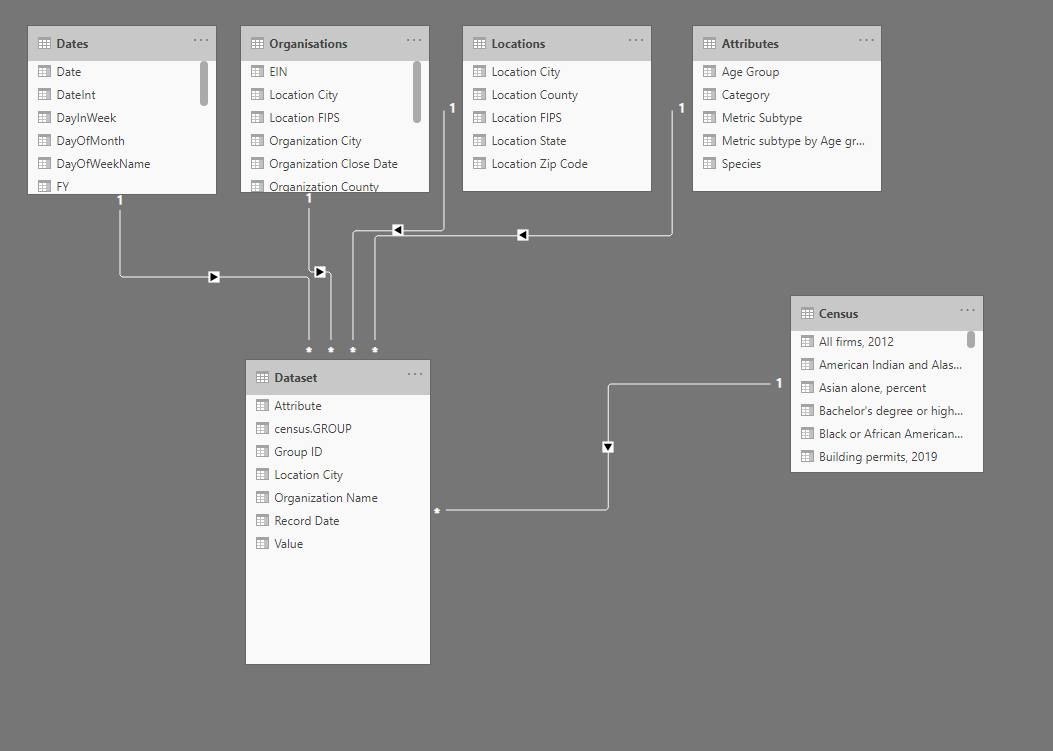
Hi, I am still wondering on these questions and looking forward to learn about best practices. I tried to create a sample model as @greg suggested, to help describe the issue.
Meanwhile, i have been researching and watching videos in the portal, following is my thinking so far. It will be helpful if someone could shed more light on the issues and logic to be followed:
Since each organisation in ‘organisations’ table may cover multiple locations in locations table so it feels i may better have Organisations >> Locations >> Dataset as a basic model structure.
Furthermore, i may treat ‘census’ table as a separate fact table linked to locations table.
Hi @ahmed9s. My apologies for the delay in getting back to you … work/eDNA Forum/eDNA challenges seem to have exposed a flaw in my to-do list. On to your issue.
Yes, it is OK to have “dimensions of a dimension” … this is most often called a snowflake model as opposed to the more traditional star model. In your case, yes, the tables should “waterfall” from [Organizations] to [Locations] to [Dataset] (e.g., one organization has many locations, one location has many data points, and you can then aggregate the data points as required to either the location or the organization level).
You do have an issue, however, as it appears that it will be challenging to compare your [Census] table to the [Dataset] table, as they appear to be at different granularities ([Census] is at the organization level, while [Dataset] is at the location level). Going forward, one would hope that you can access your census data at the location level rather than at the organization level. (On a side note, I’d hope the [Organization Name] column can be removed from the [Dataset] table, as it is (hopefully) unnecessary for linking and looks confusing.)
So, to sum up, I’d hope you can:
use [Location FIPS] as the link between [Dataset] and [Locations]
use [Organization Name] as the link between [Locations] and [Organizations]
source your census data at the location (city) level and use [Location FIPS] as the link between [Census] and [Locations]
As a supplement to @Greg’s excellent response above, you may want to take a look at the thread below which has some good information about the pros and cons of snowflake vs. star schemas.
Thank you @Greg, it is very helpful and generous of you. And thanks for the additional advise. With your understanding of my data model, can you also suggest what would be an optimum transformation for the census table:
unpivot all the census data points and perhaps use some sort of dynamic column type format to distinguish between percentages and whole numbers (if that’s even possible) or leave them all in separate columns. Are there resources to learn about this issue?
Thank you @BrianJ, combined with the discussion in your links. I am gaining deeper insights.
Hi @ahmed9s. Unpivoting any table (census, in your question/case) results in an Attribute and an Value column; in this case, as the Value column contains both strings and numbers, it is of text type. You can “fake” a dynamic format by converting all values to numbers, then formatting them as strings using something like:
Formatted Value Test =
-- check for blank
-- check for zero
-- check for percent
-- check for < 1
-- else use thousands separator
SWITCH( TRUE(),
    ISBLANK( 'Census (Transformation Test)'[Value as number] ), BLANK(),
    'Census (Transformation Test)'[Value as number] = 0, "0",
    CONTAINSSTRING( 'Census (Transformation Test)'[Attribute], "Percent" ), FORMAT('Census (Transformation Test)'[Value as number], "####%" ),
    'Census (Transformation Test)'[Value as number] < 1, FORMAT( 'Census (Transformation Test)'[Value as number], "0.##0" ),
    FORMAT( 'Census (Transformation Test)'[Value as number], "#,##0" )
    )
(This DAX is just an initial proof-of-concept test and does not handle all situations gracefully; if you choose to use such a method, then further development is warranted.)
Transformation, however, does not affect the basic issue that the grain of the [Census] table doesn’t match that of the [Dataset] table.