Attached is a raw xlsx-file containing public data from the German Federal Statistical Office on student numbers.
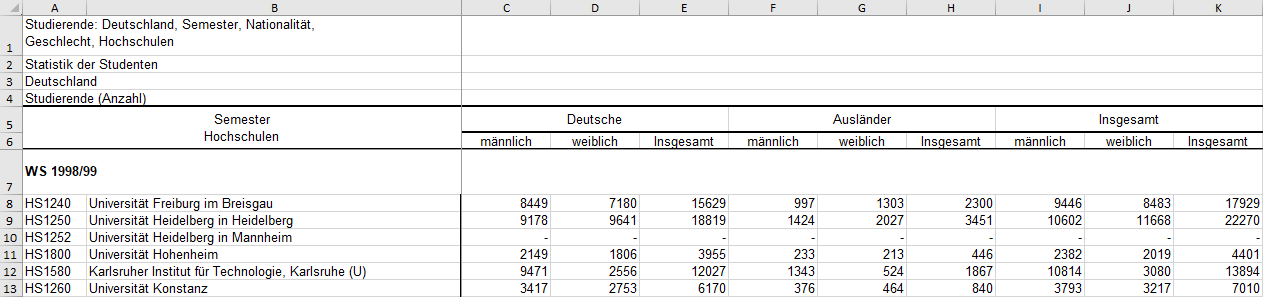
It contains data per university (rows) on number of students specified by nationality (three top columns read “Germans” “Foreigners” and “Total”) and sex (“male” “female” “total” for each top column). It starts with data for the winter semester 1998/99 and continues on for each winter semester.
Here is a image snippet to get a first impression of the wide table.
Hi Japjeet, wow, thanks! This is very helpful - it really motivates me to really dive into Power Query!
Could you take just another small look?
The original table contains time data. Starting with wintersemester 1998/99 (WS 1998/99) each university is repeatedly listed for following wintersemesters. Some unis don’t add until later semesters as they are founded more recently.
I’m racking my brain on how it’s going to work that the dimension “semester” doesn’t get lost, so that I can analyse changes in numbers over time, and how I should format “1998/99” in order to be useful.
Again, there are severalways to that depending on if new data will be on different file or existing file etc…
for simplicity, in your scenario i can recommend that as you get more data, keep the existing data and just paste new rows at the end in the same excel file and refresh the report.
that should work for you.
Again once you do some reading / learning in Power query, most of these questions will be resolved.