Banded column shading - Using Conditional Formatting?

Hi,

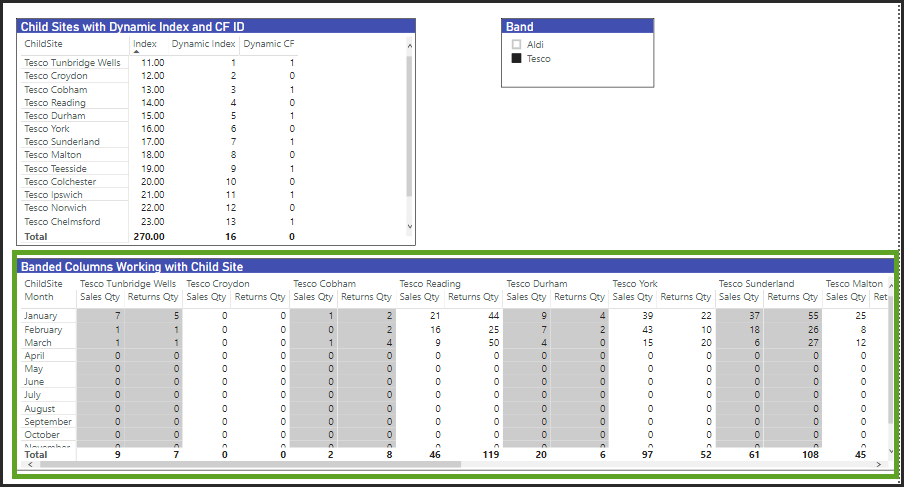
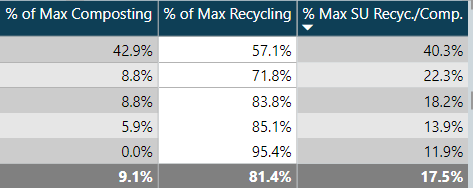
We have a matrix table which shows 2 measures, with Store Names in the Columns field going across the report. To make the report more readable we would like to create our own banded column shading, as in the mock up below (taken from the Contoso dataset using Continent instead of Store Name):

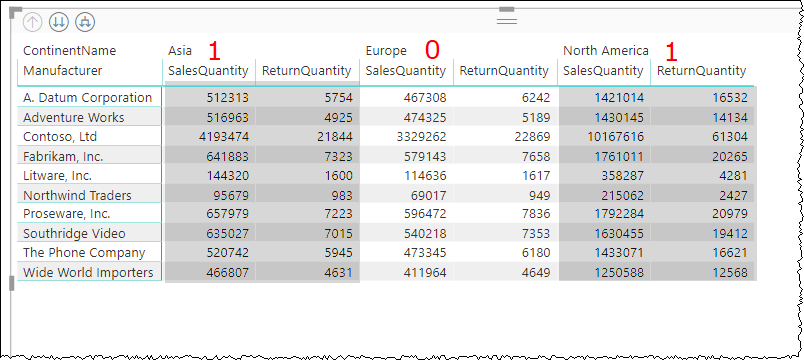
I thought this could be achieved using Background Colour Conditional Formatting, if I could assign an alternating value to each Store, in the selected dataset, eg: 1, 0, 1, 0 etc

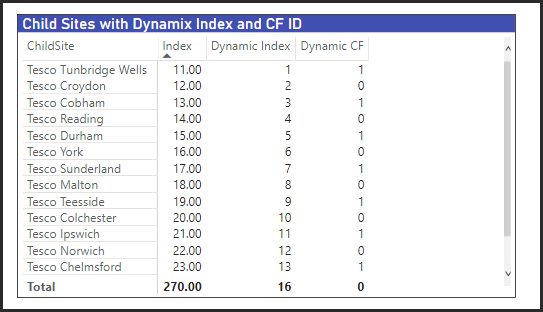
I know that if I can find out how to return a derived sequential ‘row’ number for my stores, then using MOD(row_number, 2) will return my alternating 1,0,1,0.

However I am struggling with the DAX to return this sequential number? The code would need to respect any filters applied by the user, so we could have 3 sets of columns (Store Names) or 20 sets of columns.

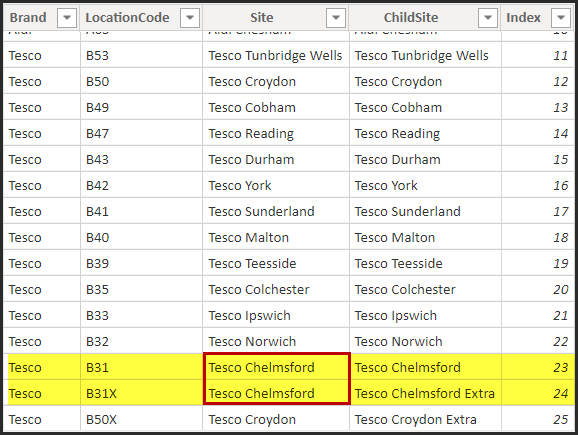
The other complication, is that our ‘Stores’ table has examples where we have more than one record per Store Name, due what we call ‘Child Stores’, so I think the DAX would first need to summarise our Stores table by Store Name, so we have 1 distinct value per Store Name and then work out this ‘row_number’

Any thoughts really appreciated!

Mark

@Mark,

I think there is a MUCH easier way to accomplish this that doesn’t require any DAX at all, nor conditional formatting:

  1. in the formatting options, under Style choose Flashy rows
    image

  2. in the formatting options, under Values set the font, background color, alternate font and alternate background color:

image

  1. under Field Formatting, select the field(s) you don’t want formatted, and enter the font and background colors that you want to override the selections made above in 2)

image

and Presto! formatted per your requirement and fully dynamic:

image

Hope this is helpful.

  • Brian

Hi @BrianJ

Again thanks for taking the time to help me here :slight_smile:

Unfortunately I don’t think that suggestion will work for my requirement. If you look back at my screenshot, I have two measures (Sales Qty and Returns Qty) which get repeated with every instance of continent. I want the first pair to be grey, the 2nd pair to be white, the 3rd pair to be grey etc.

If I followed your example, I could indeed make Returns Qty be white, which would give me a ‘traditional’ banded style, but my need is to band each continent, eg each pair of measures together. So for the first pair Returns Qty is white, the 2nd pair Returns Qty needs to be grey etc.

Thanks

Mark

@Mark,

I think it will still work with the following modification - instead of two measures dropped into the “Columns” well, set up three separate pairs (each with a separate filter condition for continent equals Asia, North America, Europe respectively) and drop those into the “Values” well.

It’s a little bit of a brute force solution, but a whole lot easier than developing a dynamic DAX-based solution, where you are still going to have to do a lot of fiddling with the conditional formatting options. As Patrick LeBlanc from the “Guy in a Cube” videos always says "I’m not lazy, just efficient… " :wink: ).

  • Brian

@BrianJ

Again thanks, but unfortunately that approach won’t work either. As said in my OP, we could have 3 sets of paired dimension values or 20 or 10 or 8 etc etc. The 3 continents was just for my example.

As Patrick LeBlanc says ‘You know how I like to do it, lets head into my laptop:laughing:

Banded Columns.pbix (156.6 KB)

Tab 1 'Banded Rows 1’ has it all working well using my Custom Formatting idea…

I finally got this by using the 3 columns as shown in the table ‘‘Child Sites with Dynamic Index and CF ID’’

2

Index - Created Using Transform Data and adding an Index Column to the Sites table.
Dynamic Index - Created using RANKX. Whatever filters are applied, this will give a new index starting from one.
Dynamic CF - Created using (MOD,2) over Dynamic Index:

However…

My complication is that in table Sites, we have the concept of ‘Child Site’ and ‘Site’.

3

A Child Site would be something like ‘Tesco Chelmsford Extra’ , whereas its main ‘Site’ would be ‘Tesco Chelmsford’. All our reporting is done at the ‘Site’ level, so records coming in for B31 and B31X are all automatically aggregated up to B31.

This causes a complication in my indexing - see tab 2 'Banded Rows 2 - Using Site’

Here I am trying to report at the desired ‘Site’ level. However the indexing and resulting MOD is not giving a consistent result, due to having two records for one ‘Site’:


I have just found a sort of workaround, by employing a ‘Parent Site’ table, which is a summary of ‘Sites’ at the Site level, thus merging my two sites into one. See tab 3 'Banded Rows 3 - Using new Parents Sites table’

However, ideally I would like to avoid adding an extra table into my datamodel just to satisfy this requirement. Ideally I want to find a way to modify my ‘Dynamic Index’ calculation on tab 2, so that it ignores the Child Sites and gives me consistent 1,0,1,0…

Thanks

Mark

Hi @Mark, we aim to consistently improve the topics being posted on the forum to help you in getting a strong solution faster. While waiting for a response, here are some tips so you can get the most out of the forum and other Enterprise DNA resources.

  • Use the forum search to discover if your query has been asked before by another member.

  • When posting a topic with formula make sure that it is correctly formatted to preformated text </>.

  • Use the proper category that best describes your topic

  • Provide as much context to a question as possible.

  • Include demo pbix file, images of the entire scenario you are dealing with, screenshot of the data model, details of how you want to visualize a result, and any other supporting links and details.

I also suggest that you check the forum guideline https://forum.enterprisedna.co/t/how-to-use-the-enterprise-dna-support-forum/3951. Not adhering to it may sometimes cause delay in getting an answer.