Hi,
I’ve created an Average for Last 6 months using Averagex, only issue being some days I have zero values, which I’d like to remove from the calculation. (I’m assuming Averagex takes into account the zeros?)
What is the best way to do this?
Average Units Last 6mths =
CALCULATE (
AVERAGEX ( Units, [Total Units] ),
DATESINPERIOD ( Date_Table[Date], TODAY() - 1, -6, MONTH )
)
Containers Last 6mth.pbix (147.1 KB)
Thanks
David
Hi @DavieJoe ,
Yes, the averagex does take into account the zeros (even tested with dummy data), it takes all values (which have a date) with the given condition Datesinperiod .
A possible solution is : add a filter with saying the unit value <> 0 , more filters can be added.
There are probably other solutions as well.
Average Units Last 6mths =
CALCULATE (
AVERAGEX ( Units, [Total Units] ),
DATESINPERIOD ( Date_Table[Date], TODAY() - 1, -6, MONTH ),
FILTER( Units, [Units] <> 0))
Kind regards, deltaselect
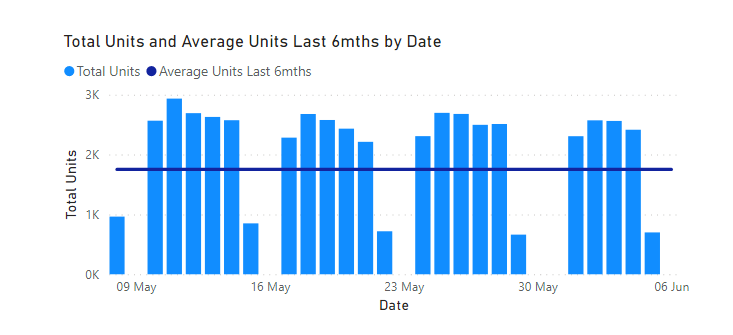
Unfortunately this does not work as when you add this measure with the filter you added I lose the static/flat line.
Thinking on it again, I could exclude weekends completely as Saturdays being it right down and Sunday’s are where all the zeroes are.
@DavieJoe AVERAGEX ignores BLANKS and not explicit Zeroes. Also, Context Transition on a FACT table?

Average Units Last 6mths =
CALCULATE (
    DIVIDE ( [Total Units], COUNTROWS ( Units ) ),
    DATESINPERIOD ( Date_Table[Date], TODAY () - 1, -6, MONTH ),
    Units[Units] <> 0
)
4 Likes
Will check this out in the morning @AntrikshSharma and thanks as always for your assistance!
@DavieJoe No problem, regarding why @deltaselect’s answer gives zig zag lines is that when you use FILTER( Units, [Units] <> 0)) you are actually referring to the expanded table Units, which contains columns for the dates table.
DATESINPERIOD creates a filter context, and then second argument of CALCULATE also creates a filter context, and when it is time to merge both you have a list containing 6 months and then other aregument is filtered by the axis/external filter context, so for 9th may you have only 1 row of Units table visible and the corresponding value in the Dates table is also for 9th May.
Since CALCULATE evaluates its filter arguments in an AND operation, both filters are merged and all the values that intersect are applied to the filter context, and you only get 9th may and Unit <> 0 in filter context, in easy words you are basically plotting bar chart with line chart for the same points.
Conclusion - Never prepare filter context by using FACT table and same goes for DIMENSIONS in case of SNOWFLAKE schema
5 Likes
Hi @AntrikshSharma,
Thanks for your clear expert explanation, learned again. I am happy to use your formula.
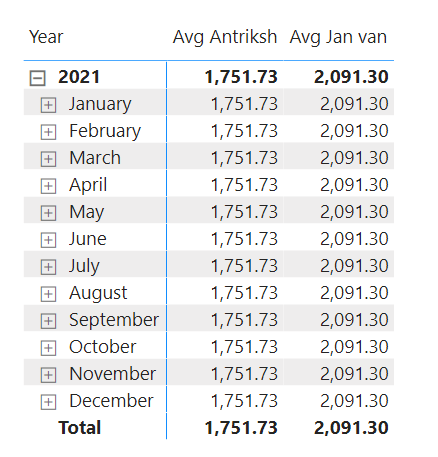
What I do not understand is that my proposed formula seems to work fine in the dummy file as provided, it gives 2.091,05 in a flat line as outcome, the same outcome as from your formula, see attached:.
Containers Last 6mth with avgx.pbix (147.4 KB)
Thanks in advance, Jan van der Wind
1 Like
@DavieJoe ,
FYI – whenever Power BI creates a 1:1 relationship, I immediately change that to a 1:M unidirectional, and you can do so without adding any additional data even if the current correspondence is simply one to one.
5 Likes
Thanks @BrianJ, I appreciate the little nugget 
Hi @deltaselect,
It is working correctly in this scenario because the only duplicates the table has are for 0, so when 0 is applied to filter context it filters 25 rows for each date from January 4th till February 1st, so 25 times 0 filters 25 rows, but the aggregation of 0 is also 0, but if this was any other number then the result would have been inflated.
To test I replaced 0 with 1 and here are the results:
Containers Last 6mth with avgx.pbix (131.7 KB)
4 Likes
Hi @AntrikshSharma , can you share a resource where I can deep dive into learning how to prepare filter context without using the fact table and dimensions?