Hello all,
I need to do 2 average measures. The normal one and the cumulative measure, both in dax.
My TimeSheet table has time value in hours (1,2) and unit value according some factors, and another with Total Value (Value).
What i would like to have is the average of Value (which is , for each client, employee,project, for a particular period, chosen on the filter box. Basically i need to know the average for each column in yellow (attach file) This measures i’m gonna show them in a graphic visual with month and year as x values.
Now, as for my “regular” averagex, i thought it could be something like this:
Average Value = AVERAGEX( ‘Tab TimeSheet’, ‘Tab TimeSheet’[Value])
My table is the other fact table so, for me to have the total of value, for example :
Can any of you help me to do these 2 measures (normal and cumulative)? Maybe i will understand once and for all the concept with and without context and when to use ALL, or ALLSELECTED, and so on
Thank you all and i’m sorry to boder you again
PedroAverageX.xlsx (34.2 KB)
Hi @pedroccamara. Can you please attach your work-in-progress PBIX and an Excel mock-up of your desired outcome to help the forum members analyze your current state and visualize the issue? Also, when posting, please format all DAX code using the built-in formatter.
Greg
Hey @Greg
I hope you can understand about not sending you my pbi file, due to the info in it and also, 3 fact tables and a couple more lookups it’s very long to mask it.
But, please, ask me whatever you need to know.
1 thing, that i didn’t told you but it was implicit, is that this table of times is connected through date table with a relationship because there’s another table with an active relationship. I mean, i’ve created the relation but it is “doted”, you know?
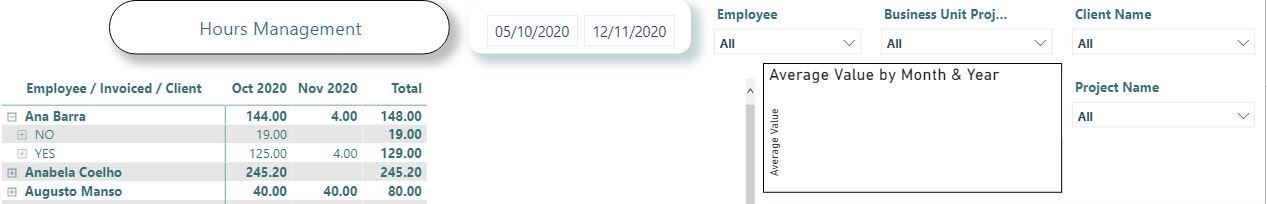
Sending you the desired outcome
On your left you get to see the detail of time by employee, invoiced and client. Above on the right, those filters and in the middle right, a graph that it was suppose to show the average by month & year.
I’m gonna be right here. So please ask me whatever you need.
And my apologies for not sending you the pbi file
Hi @pedroccamara. Yes, I do understand, but it would be a good idea for you to compose, perhaps, a sample PBIX that illustrates your work-to-date and the issue you’re facing. You already sent a dataset, so if this isn’t proprietary perhaps a new PBIX could be built from this dataset that has all tables and relationships, and the work-in-progress measures you described in your first post.
Greg
Hi @pedroccamara, we’ve noticed that no response has been received from you since the 12th of November. We just want to check if you still need further help with this post? In case there won’t be any activity to post the sample PBIX that illustrates your work-to-date and the issue you’re facing in the next few days, we’ll be tagging this post as Solved. If you have a follow question or concern related to this topic, please remove the Solution tag first by clicking the three dots beside Reply and then untick the checkbox. Thanks!