Average specific days aging

Hello once again EDNA - worked on this for a while and unable to come up with a answer. I have two measures.

  1. Counts distinct widget aging 90 days or less.
90 Days = 
VAR LastSelectedDate = MAX (CalFree[Date])

RETURN
        CALCULATE (
            DISTINCTCOUNT ( TH[TNo]),
            FILTER (
                SUMMARIZE (
                    TH,
                    TH[EffDDate],
                    TH[EDate]
                ),
                INT (
                    IF (
                        TH[EffDDate] < LastSelectedDate,
                        TH[EffDDate],
                        LastSelectedDate
                    )
                        - TH[EDate]
                )
                    <91
            ),
            TH[EDate] < LastSelectedDate,
            TH[EffDDate] > LastSelectedDate
        )
  1. Averages the number of days for all aging widgets.
DaysAging = 
    VAR LastSelectedDate = MAX (CalFree[Date])

    RETURN
        CALCULATE (
           AVERAGEX(TH,
            1.*(IF(ISBLANK(TH[DDate]), LastSelectedDate-TH[EDate],
                    TH[DDate]-TH[EDate]
                    )
                    )+1
                    ),
                 
            KEEPFILTERS ( TH[EDate] < LastSelectedDate ),
           KEEPFILTERS ( TH[EffDDate] > LastSelectedDate)
    
       )

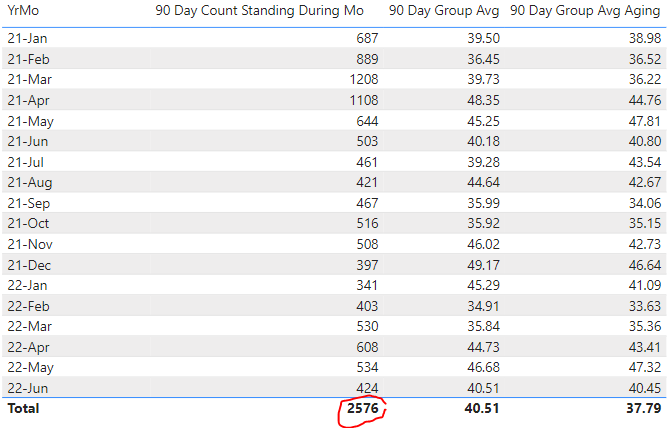
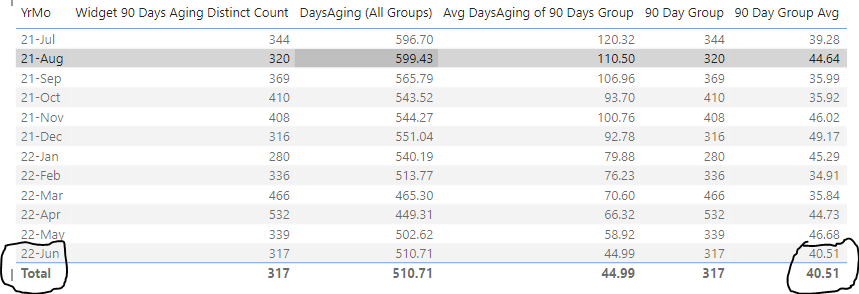
I’m looking for the average days of the 90 days group and the 120 group and so on.

My attempt at combining these two measures:

Avg Days Aging 90 Days = 
    VAR LastSelectedDate = MAX( CalFree[Date] )
    
    RETURN
        CALCULATE (
           AVERAGEX(TH,
            1.*(IF(ISBLANK(TH[DDate]), LastSelectedDate -TH[EDate],
                    TH[DDate]-TH[EDate]
                    )
                    )+1
                    ),

                    FILTER (
                SUMMARIZE (
                    TH,
                    TH[EffDDate],
                    TH[EDate]
                ),
                INT (
                    IF (
                        TH[EffDDate] < LastSelectedDate ,
                        TH[EffDDate],
                        LastSelectedDate 
                    )
                        - TH[EDate]
                )
                        <91
                    ),
                 
            KEEPFILTERS ( TH[EDate] < LastSelectedDate ),
           KEEPFILTERS ( TH[EffDDate] > LastSelectedDate )
    
       )

didn’t work for me. the farther I went back in time with the date slicer, the number of days went higher then 90 days avg. If I’m trying to get the avg. days of the 90 days group , it should stay below 90 days.

Thanks for your time in advance,

Frankee.

attaching PBI

TH.pbix (1.0 MB)

bumping this post

Hey @Frankee

New to the forum, but hopefully this helps. Based on my guess of what your 3 date fields mean, and re-using some of your DAX… would these work instead?

90 Day Group = 
VAR LastSelectedDate = Max(CalFree[Date])

VAR vFilteredGroup  = FILTER(
                        ADDCOLUMNS(TH,
                        "Age", DATEDIFF(TH[EDate], IF (TH[EffDDate] < LastSelectedDate, TH[EffDDate], LastSelectedDate), DAY)
                        ),
                            TH[EDate] < LastSelectedDate
                        &&  TH[EffDDate] > LastSelectedDate
                        && [Age] <= 90
                        )

RETURN COUNTROWS(vFilteredGroup)  -- quick count only, you'd need to swap to your Distinct if applicable

So the group average would be…

90 Day Group Avg = 
VAR LastSelectedDate = Max(CalFree[Date])

VAR vFilteredGroup  = FILTER(
                        ADDCOLUMNS(TH,
                        "Age", DATEDIFF(TH[EDate], IF (TH[EffDDate] < LastSelectedDate, TH[EffDDate], LastSelectedDate), DAY)
                        ),
                            TH[EDate] < LastSelectedDate
                        &&  TH[EffDDate] > LastSelectedDate
                        && [Age] <= 90
                        )

RETURN AVERAGEX(vFilteredGroup, [Age])

Let me know how you go :slight_smile:

1 Like

Hey @MichelleLe - Welcome to the EDNA. Both worked from what I can tell so much data :slight_smile: .

I liked how the first measure simplified my code…much cleaner. second measure was a continuation of the same. AWESOME!

the [90 Day Group Avg] in a table it returns the MAX of last selected month in the slicer. is it possible to return the Average of the range selected in the slicer. see pic I’ve selected a year. as it stands now the total it the total of the last month and not the Average.

Again thank you for your time in advance,

Frankee

Glad to hear it’s on the right track.

I made assumptions on your requirements based on your existing model/measures. That being:-

  1. The Calendar not being linked to any specific dates, and
  2. The original filter below:
  • I took these filters above as saying, “here is what remains Active at the end of each period, and the age of the Widget at that point” … i.e. the EffDate > LastSelectedDate
  • So my proposed measures above will satisfy “As at the end of each reporting month (within the slicer range), here is the average age of those that are active <= 90 days”; and technically, the “Total” will still be the same as the last period as at max date.

To understand how to re-tackle the Total Avg, please could you confirm your overall requirement/definition again, and the expected results? E.g.

  • What does your Date Slicer range represent?
  • What would you expect the Total result to be? Avg of end of month avgs?
  • Are we measuring those Active at end of month, or age of those that have an EffDDate to see how long they were active for? etc.

Cheers
M

@MichelleLe -thanks again for taking the time.

Disconnected calender / slicer gives me the rolling 12 months.

End of Month Active, we have in this measure :
90 Day Group (@ month end)

Great point in your comments above. Because of it
I would like to see:

  1. Widgets active during month/average.

  2. If added to a matrix , i would like the total to be the Average active during the selected period in the calendar slicer. Depending on the audience, they want to see 1 qtr, 1 year or last 5 years.

Thanks alot for your time,

Frankee.

Hey @Frankee, I reread the thread and your response, and I think this is more like it?

90 Day Group Avg Again = 
VAR FirstSelectedDate = Min(CalFree[Date])
VAR LastSelectedDate = Max(CalFree[Date])

VAR vFilteredGroup  = FILTER(
                        ADDCOLUMNS(TH,
                        "Age", DATEDIFF(TH[EDate], IF (TH[EffDDate] < LastSelectedDate, TH[EffDDate], LastSelectedDate), DAY)
                        ),
                            TH[EDate] < LastSelectedDate
                        &&  TH[EffDDate] > FirstSelectedDate
                        && [Age] <= 90
                        )

RETURN AVERAGEX(vFilteredGroup, [Age])

Basically, just added the FirstSelectedDate in and updated your original filter so we can look at “ALL active” during that period, not just “STILL active”.

&&  TH[EffDDate] > FirstSelectedDate

You’ll need to apply same changes to the first measure too (90 Day Group count).

Let me know how you go
M

1 Like

Hello @MichelleLe . the help is much appreciated. Spent most of the day going thru the data (so much data uggg.) :face_with_peeking_eye: I made two edits to your measure, where I added the equal sign.

by adding the equal sign to [EDate] , we gained six (6) additional widgets. w/ [EDate] of 6/30.
by adding the equal sign to [EffDDate], we gained seven (7) additional widgets, w/ [EffDDate] of 6/1.

90 Day Count Standing During Month = 

VAR FirstSelectedDate = Min(CalFree[Date])
VAR LastSelectedDate = Max(CalFree[Date])

VAR vFilteredGroup  = FILTER(
                        ADDCOLUMNS(TH,
                        "Age", DATEDIFF(TH[EDate], 
			IF (TH[EffDDate] < LastSelectedDate, TH[EffDDate], LastSelectedDate), DAY)
                        ),
                            TH[EDate] <= LastSelectedDate
                        &&  TH[EffDDate] >= FirstSelectedDate
                        && [Age] <=  90
                        )

RETURN COUNTROWS( (vFilteredGroup))

Would you have any concerns about this edit your self ?

@Frankee looks good to me - definitely needed the equal sign edit!

My only other thought is, whether you will have records where the start/end date is on the same day, and therefore you just need to decide how to handle that (is it not valid, is it counted as active, is it counted as both active and closed in the period etc).

@MichelleLe - great point. I’ve communicated this already.

see pic of first column [90 Day Count Standing During Mo]:
the total is not translate.

image

90 Day Count Standing During Mo = 

VAR FirstSelectedDate = Min(CalFree[Date])
VAR LastSelectedDate = Max(CalFree[Date])

VAR vFilteredGroup  = FILTER(
                        ADDCOLUMNS(TH,
                        "Age", DATEDIFF(TH[EDate], 
			IF (TH[EffDDate] < LastSelectedDate, TH[EffDDate], LastSelectedDate), DAY)
                        ),
                            TH[EDate] <= LastSelectedDate
                        &&  TH[EffDDate] >= FirstSelectedDate
                        && [Age] <=  90
                        )

RETURN COUNTROWS( (vFilteredGroup))

Thank you again :slight_smile:

Frankee