Average Sales by month over a 3 year rolling Period

Hi All,

Hoping someone can help me with a 2second Excel average to ME NOT having a clue where to start in PBI.

I have Year/Month/Test Sales, which looks like the below for the 12 months ( Nov and Dec will show 2019 until the months are completed and will then show 2022 )

Year	Month	Test Sales
2020	Jan	           399
2021	Jan	          239
2022	Jan	          323
2020	Feb	         329
2021	Feb	         186
2022	Feb	       198
2020	Mar	       177
2021	Mar	      146
2022	Mar	     168
2020	Apr	    36
2021	Apr	     125
2022	Apr	    143
2020	May	45
2021	May	111
2022	May	149
2020	Jun	67
2021	Jun	107
2022	Jun	126
2020	Jul	93
2021	Jul	96
2022	Jul	110
2020	Aug	91
2021	Aug	99
2022	Aug	121
2020	Sep	127
2021	Sep	130
2022	Sep	145
2020	Oct	147
2021	Oct	184
2022	Oct	233
2019	Nov	286
2020	Nov	231
2021	Nov	248
2019	Dec	235
2020	Dec	234
2021	Dec	167

I am then looking for the DAX to average the months to show a table like :

Month	Average of Test Sales
Jan	     320.3
Feb	    237.7
Mar	   163.7
Apr	   101.3
May	101.7
Jun	    100.0
Jul	   99.7
Aug	   103.7
Sep	  134.0
Oct	   188.0
Nov   255.0
Dec	   212.0

Many Thanks for your time and help

Rich
Hi @rich871071 ,

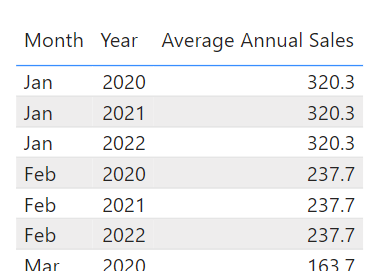
I propose solution for average on Yearly bases ( average annual sales based on dimension what you display - in your case Month

Average Annual Sales = CALCULATE (AVERAGEX(ALL('Sample'[Year ]),[Sales]), REMOVEFILTERS('Sample'[Year ] ))

and then remove filters for year so it can be displayed also in this context:

image

Please find attached PBIX file sample:

Example_for_Rich.pbix (20.9 KB)
Sample_for_Rich.xlsx (8.9 KB)

Hope it helps

Best regards,
Maja

Hello @rich871071,

Thank You for posting your query onto the Forum.

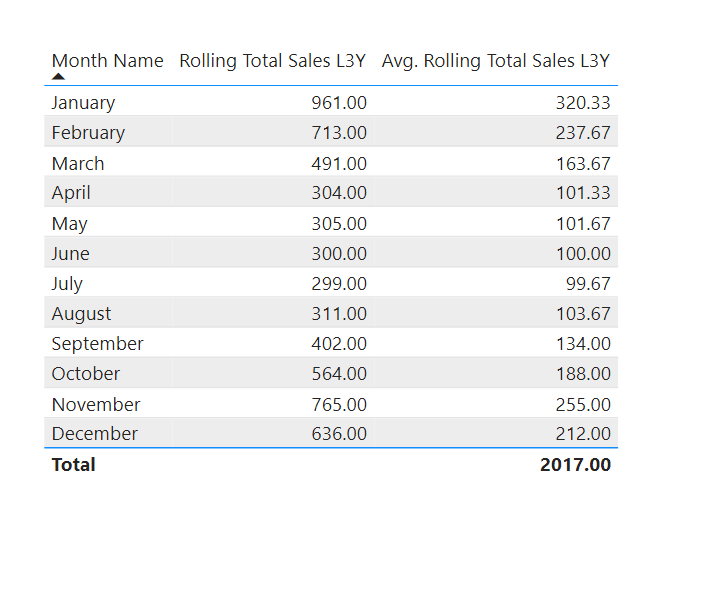
In order to achieve the results based on the scenario that you’ve mentioned i.e., for completed months, years will be considered as 2022, 2021 and 2020 whereas for incompleted months, years will be considered as 2021, 2020 and 2019. Below are the couple of DAX measures alongwith the screenshot of the final results provided for the reference -

Rolling Total Sales L3Y = 
VAR _Total_Sales_Month_Completed = 
SUMX(
    ADDCOLUMNS(
        FILTER(
            SUMMARIZE(
                Data , 
                Dates[Date] , 
                Dates[Year] , 
                Dates[Month Name] ,
                Dates[MonthCompleted] , 
                Dates[YearOffset] ,
                Data[Sales] ) , 
            Dates[MonthCompleted] = TRUE() && 
            Dates[YearOffset] >= -2 ) , 
        "@Total_Sales" ,
        CALCULATE( SUM( Data[Sales] ) ) ) , 
    [@Total_Sales] )

VAR _Total_Sales_Month_Not_Completed = 
IF( SELECTEDVALUE( Dates[MonthCompleted] ) = FALSE() , 
SUMX(
    ADDCOLUMNS(
        FILTER(
            SUMMARIZE(
                Data , 
                Dates[Date] , 
                Dates[Year] , 
                Dates[Month Name] ,
                Dates[MonthCompleted] , 
                Dates[YearOffset] ,
                Data[Sales] ) , 
            Dates[YearOffset] = -3 ) , 
        "@Total_Sales" , 
        CALCULATE( SUM( Data[Sales] ) ) ) , 
    [@Total_Sales] ) )

VAR _Results = 
IF( ISINSCOPE( Dates[Month Name] ) , 
    _Total_Sales_Month_Completed + _Total_Sales_Month_Not_Completed , 
    BLANK() )

RETURN
_Results
Avg. Rolling Total Sales L3Y = 
VAR _Correct_Totals = 
SUMX(
    ADDCOLUMNS(
        SUMMARIZE(
            Dates , 
            Dates[Month Name] ) , 
        "@Totals" , 
        [Rolling Total Sales L3Y] ) , 
    [@Totals] )

VAR _Results = 
DIVIDE(
    _Correct_Totals , 
    3 , 
    0 )

RETURN
_Results

I’m also attaching the working of the PBIX file for the reference purposes.

Hoping you find this useful and meets your requirements that you’ve been looking for.

Thanks and Warm Regards,
Harsh

Avg. Rolling Total Sales L3Y - Harsh.pbix (113.9 KB)

Hello @rich871071,

You can also try the revised DAX measures as well -

Rolling Total Sales L3Y = 
VAR _Total_Sales_Completed_Months = 
SUMX(
    ADDCOLUMNS(
        FILTER(
            SUMMARIZE(
                Data , 
                Dates[Year] , 
                Dates[MonthOfYear] , 
                Dates[MonthCompleted] , 
                Dates[YearOffset] ) , 
            Dates[MonthCompleted] = TRUE() &&
            Dates[YearOffset] >= -2 ) , 
        "@Total_Sales" , 
        CALCULATE( SUM( Data[Sales] ) ) ) , 
    [@Total_Sales] )

VAR _Total_Sales_Not_Completed_Months = 
SUMX(
    ADDCOLUMNS(
        FILTER(
            SUMMARIZE(
                Data , 
                Dates[Year] , 
                Dates[MonthOfYear] ,
                Dates[YearOffset] ) , 
            Dates[YearOffset] = -3 &&
            Dates[MonthOfYear] >= MONTH( TODAY() ) ) , 
        "@Total_Sales" , 
        CALCULATE( SUM( Data[Sales] ) ) ) , 
    [@Total_Sales] )

VAR _Results =
_Total_Sales_Completed_Months + _Total_Sales_Not_Completed_Months 

RETURN
_Results
Avg. Rolling Total Sales L3Y = 
DIVIDE(
    [Rolling Total Sales L3Y] ,
    3 , 
    0 )

Attaching PBIX file for reference purposes.

Thanks and Warm Regards,
Harsh

Avg. Rolling Total Sales L3Y - Harsh v2.pbix (116.1 KB)

1 Like