I was looking for similar topic but get no clear solution to the challange I faced.
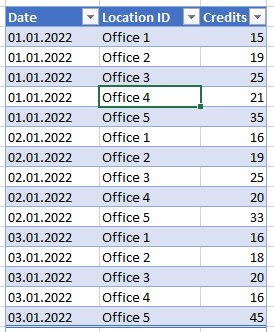
The scenario fact table #1 comprises count of users with access to the intranet (available for different locations of the Company, changing on a daily basis) like here:
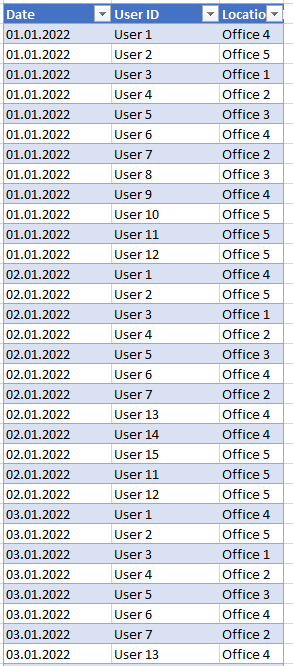
The scenario fact table #2 comprises daily IDs of users logging in to the intranet like here (of course dummy data in excel; the actual facttables have many sensitive data as well as powerbi model):
What I have already did is to compute DAU (Daily Active Users)
ActiveUsers =
CALCULATE(
    COUNTROWS(
        DISTINCT(Logs_Table[User ID])
    )
)
and average for last x days.
DAU (average L7Days) =
VAR _Number_of_Days = 7
VAR _MaxDate = SELECTEDVALUE(Logs_Table[User ID])
VAR _Period = DATESINPERIOD(Calendar[Date],_MaxDate, -_Number_of_Days, DAY)
VAR _Result = CALCULATE (
                AVERAGEX (
                    VALUES (Calendar[Date]),
                        [ActiveUsers]
                        ),
                _Period
                )
VAR FirstDateInPeriod = MINX (_Period, Calendar[Date] )
VAR LastDateWithLogging= MAX ( Logs_Table[Date])
RETURN
 IF(FirstDateInPeriod <= LastDateWithLogging, _Result,"-")
MAU (Mounthly Active Users) I got thanks to visualisation / filter context which is not probably the best practice but I made it.
So what are the challanges
- compute MAU and DAU/MAU ratio on a daily basis.
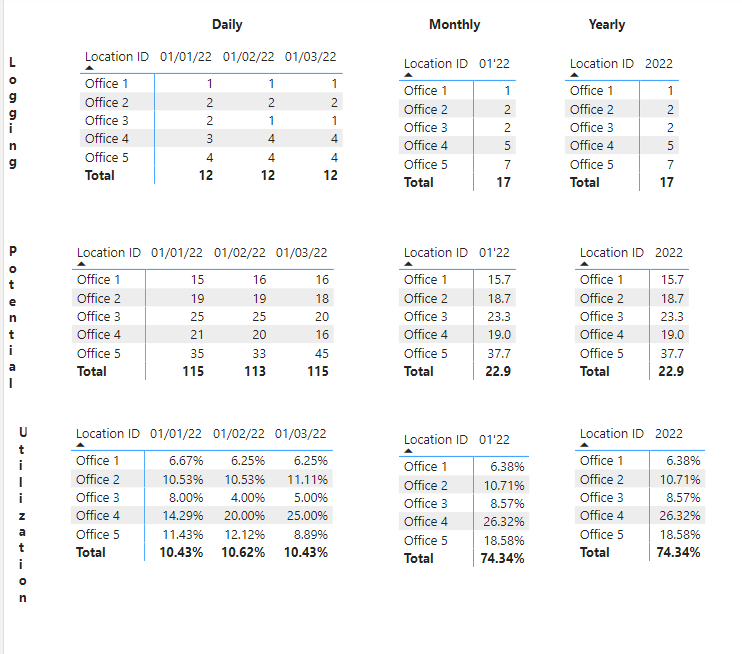
- compute the potential of users = total count of users on a monthly basis like here:
I believe the solution is about:
You will have to create multiple measures for each level of granularity:
Daily:
Daily Active Users (DAU) = CALCULATE(DISTINCTCOUNT(Logs_Table[User ID]),DISTINCT(DatesTable[Date]))
Daily Potential = SUM(Users_With_Access[Credits])
Daily Utilization = DIVIDE([DAU],[Daily Potential])
Monthly:
Monthly Active User (MAU) = CALCULATE(DISTINCTCOUNT(Logs_Table[User ID]),DISTINCT(DatesTable[MM_RR]))
Monthly Average Potential = AVERAGEX(Users_With_Access, [Daily Potential])
Monthly Utilization = DIVIDE([MAU],[Monthly Average Potential])
Yearly:
Yearly Active Users (YAU) = CALCULATE(DISTINCTCOUNT(Logs_Table[User ID]),DISTINCT(DatesTable[Year]))
Yearly Utilization = DIVIDE([YAU],[Monthly Average Potential])
For Sum of Averages, you can refer to the below blog post:
DAX Calculations Power BI: Total Of Average Results | Enterprise DNA
I have created a sample solution for your quick reference.
DAU and MAU dummy data for EDNA_Solution.pbix (59.1 KB)
2 Likes
@pranamg Much appreciate your great effort. I need to go through your solution and let you know if everuthing is working properly. At the moment I see an issue that Monthly Potential (as well as yearly) is for sure not 22,9 but rather 114,3. So the utilization is also not 74% but rather ~10%.
But as I said I will go through your proposal and apply it to my real case data and let you know .
Best
Aldek
1 Like
Thanks @Aldek_U . Yes, you are right. The totals will not display the sum as the DAX functions will only display Averages. I did not attempt Sum of Averages DAX function for totals. For that, you might have to refer to the blog post ->. DAX Calculations Power BI: Total Of Average Results | Enterprise DNA .
Hi @Aldek_U, we’ve noticed that no response has been received from you since a few days ago.
We just want to check if you still need further help with this post?
In case there won’t be any activity on it in the next few days, we’ll be tagging this post as Solved.
Hi @Aldek_U, due to inactivity, a response on this post has been tagged as “Solution”. If you have any concern related to this topic, you can create a new thread.