Hi,
I have a measure that calculates “% of total”. Now I want to assign these % to buckets like:
Bucket
Min%
Max%
100%
100
100
>97%
97.1
99.99
>95%
95.1
97
>90%
90.1
95
>80%
80.1
90
>70%
70.1
80
>60%
60.1
70
60% and Below
0
60
What is the best way to do it. I used Measure to assign these buckets but it is very slow and not so useful. I also want to use that Bucket as slicer. Please help. I can upload sample report sooner.
Agreed - I think that is one of the more difficult measures on the site to work through the logic of. But once you understand that, it’s incredibly powerful and can be used for a lot of different scenarios.
The dynamic segmentation measures are way too complex for me to diagnose what’s going on just by looking at that table. However, if you can please post your PBIX file, I’d be glad to work through the details of this with you.
Okay. I will get one for you. I may need little time for one.
I tried different ways and reached a point where it calculates correctly for few numbers and not for other. I’m definitely doing something wrong.
Here is the file that you asked. I could not replicate all problems but I mentioned some. Please let me know at least the usage of formula’s are right or wrong.
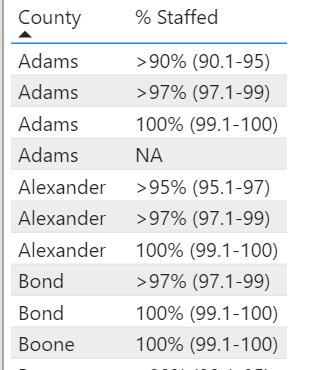
Okay. I really appreciate your time. When I created new PBIX file one thing observed was Same formula worked how it should be but did not work on my real data how hard I try. Later, I created new PBIX for my real data set and boom! it worked. Like I said, I still have problems that I have in the PBIX I gave. Also, I wanted to use ‘Filled Map’ for County, % Grouping but it is giving error -“No relationship between Tables” but It let’s me use Regular Map.
I looked at your measures and results, and those all look like they’re working fine. To get the proper % Position label into your visuals, you can use a SWITCH(TRUE() construct like the one below:
With regard to getting the filled map to work properly, I think you need to do two things first:
create a linkage between your county listings and the relevant state (IL), Otherwise it plots these counties from Washington state to France. You can do this either in Power Query or as a calculated column in DAX. The former is preferable, but since I didn’t have your original data available, I wasn’t able to manipulate it in PQ without extracting the data via DAX Studio and re-importing It, so I used a calculated column instead with the DAX code below to add the state abbreviation to the county name. Once you do that, you need to identify the new field created as county level data (see step 2 below)
Beyond that, I’m not sure what else you need to make the filled map work. However, I am looping in @Paul here, who is an absolute wiz in the use of spatial data techniques and tools within Power BI, if you need additional guidance on the filled map issue.
Hi,
The filled map seems to work fine, however, it is not the way I would want to show data, since it “zooms” to the whole country.
As Brian suggested, add a table with all counties and the state, merge in PQ, so you can filter on state and zoom to a smaller area. Also create conditional formatting so you can create a distinction between a value county and non value county.
Hi, I would like to thank you for spending time on this. I had used “if” statement similar to SWITCH before. One, it was taking a very long time to calculate (Keeps spinning/Freezes my report). Second, I need those % grouping as “Slicer”. That is the reason I went for disconnected table.
Also for Map, I have a requirement to use % as Legend in a filled Map.
Definitely I will give it another try with SWITCH, as just an experiment but still slicer and map issue will remain if I use Measure.
Yes, I’m aware of that. I did use County and State combination. Sorry! I should told what is the actual issue. it is Legend in filled map is the issue. It neither takes measure as legend nor column from disconnected table.
The SWITCH statement should work just fine as a calculated column instead of as a measure, which should solve your slicer and legend issues. Sorry – should have realized that from your earlier requirements. My gut instinct is always just to write measures, not calculated columns…