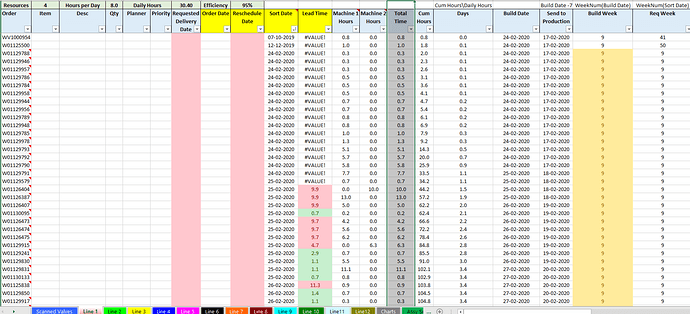
I have this project where I have to convert excel reports\charts built using excel macros into Power Pivot. It calculates the efficiency of each assembly line comparing the total capacity with actual capacity for the orders. The report is basically needed to be sorted on Data Column so that we can find the available capacity date wise. Total Capacity is based on Cumulative hours machine wise.
Problem is how to handle the sorting date wise, as operation time is available for
Hi @deepakmehra
Could you please help to share the sample file along with the expected output.
Meanwhile a workaround is to create a separate table and have index column for sorting. Like date table and add a index column to it, then you can short it the way you want.
Hi @deepakmehra, welcome to the forum! We aim to consistently improve the topics being posted on the forum to help you in getting a strong solution faster. While waiting for a response, here are some tips so you can get the most out of the forum and other Enterprise DNA resources.
Use the forum search to discover if your query has been asked before by another member.
When posting a topic with formula make sure that it is correctly formatted to preformated text </>.
Use the proper category that best describes your topic
Provide as much context to a question as possible.
Include demo pbix file, images of the entire scenario you are dealing with, screenshot of the data model, details of how you want to visualize a result, and any other supporting links and details.
I also suggest that you check the forum guideline https://forum.enterprisedna.co/t/how-to-use-the-enterprise-dna-support-forum/3951. Not adhering to it may sometimes cause delay in getting an answer.
Thanks to the contributors of this post. Due to the length by which this post has been active, we are tagging it as Solved. For further questions related to this post, please make a new thread.
