hi all,
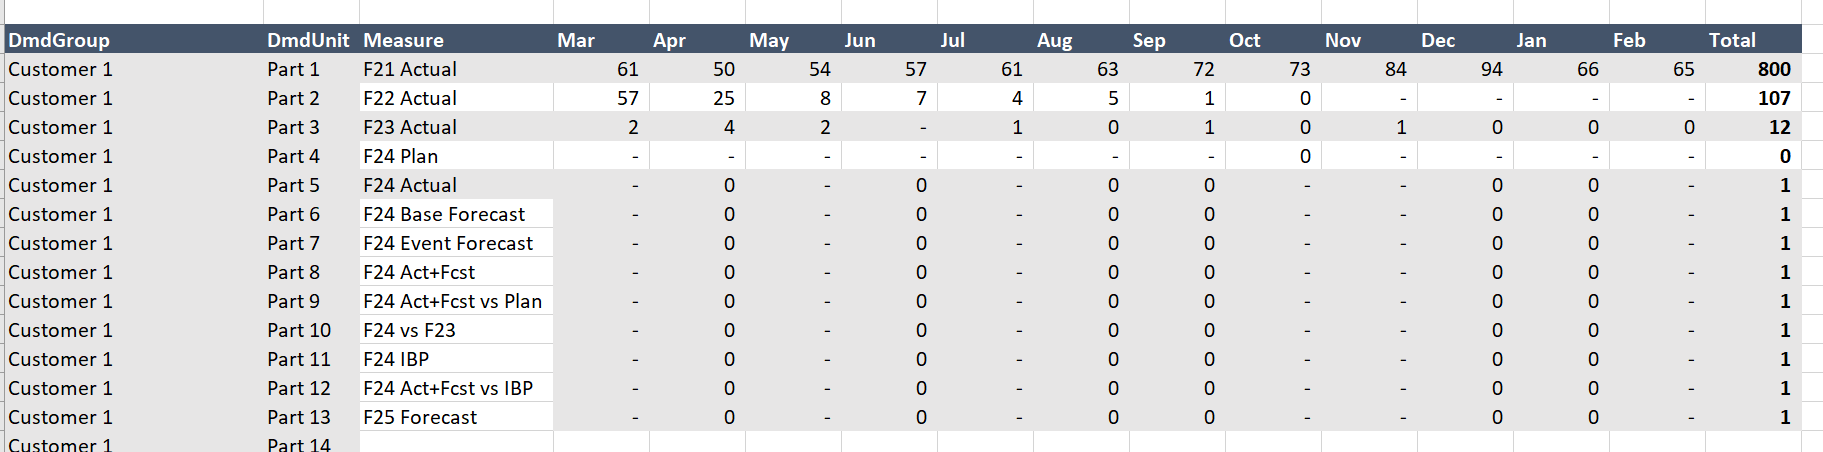
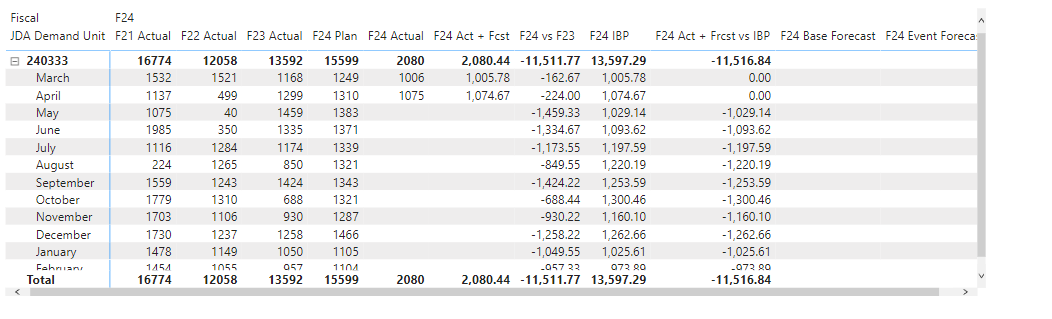
I have an excel that looks like below that I have modelled in Powerbi.
In the original excel based on the fiscal year selected, all the measure are arranged based on that fiscal year calendar. Because i selected F24, the date range is automatically sorted based on the F24 calendar
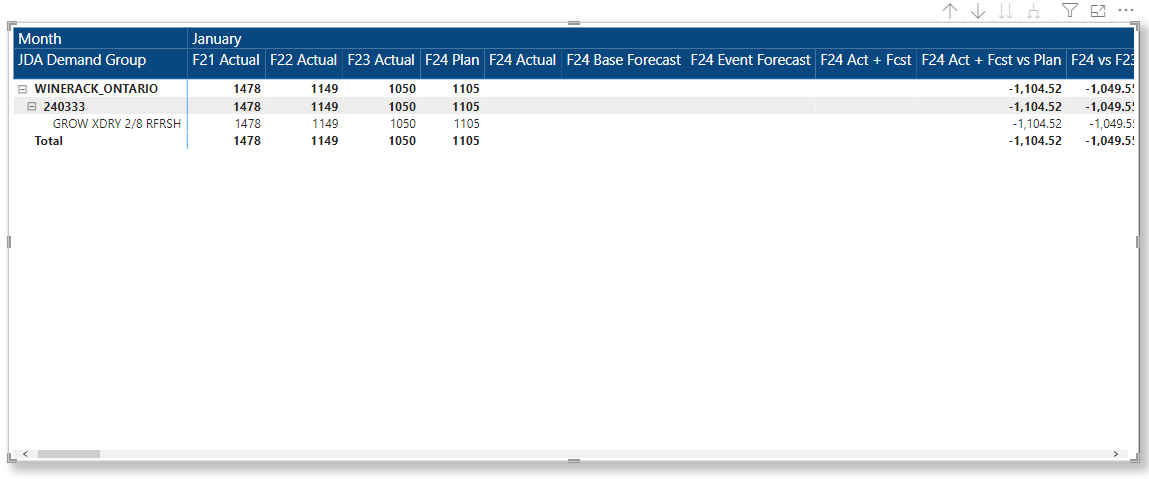
I have been able to create the measures and recrate the matrix as shown below in the image.
but i havent been able to create any sort of Fiscal year calendar that shows exactly what i have in the excel.
I tried creating some kind of sort order as shown in my model but it doesn’t work
Have you tried selecting the column you want to sort, and then in one of the ribbons, most likely column tools, theres an option to sortby, and then choosing the column you created to sort, so it sorts the column in the visual?
Yes I have tried that but it’s doesn’t sort it based on the Fiscal period
Good Evening @wilford.mitchell ,
Would a standard date table including FY and FY periods helps you out ?
See attached pbix, in the Power Query Editor you can select the required date range and the Fiscal starting month of the year. Then connect the regular date-field of this date-table to your (fact-) tables, but use the FY and FY periods in your Power-BI visuals for reporting
Example data with date query with Fiscal periods.pbix (137.1 KB)
Be aware that for reporting with time functions like YTD, the measures have to be based upon the fiscal periods and a Start date of the fiscal year is needed in the time table for “Datesinperiod” (to quickly solve this, it was added manually with Excel to the date table)
An example of a fiscal YTD measure:
FY YTD = CALCULATE( SUM( SalesT2[Turnover]),
                    DATESINPERIOD( DateT2[Date], MAX(DateT2[Start FY]), MAX(DateT2[FY Period]),MONTH))
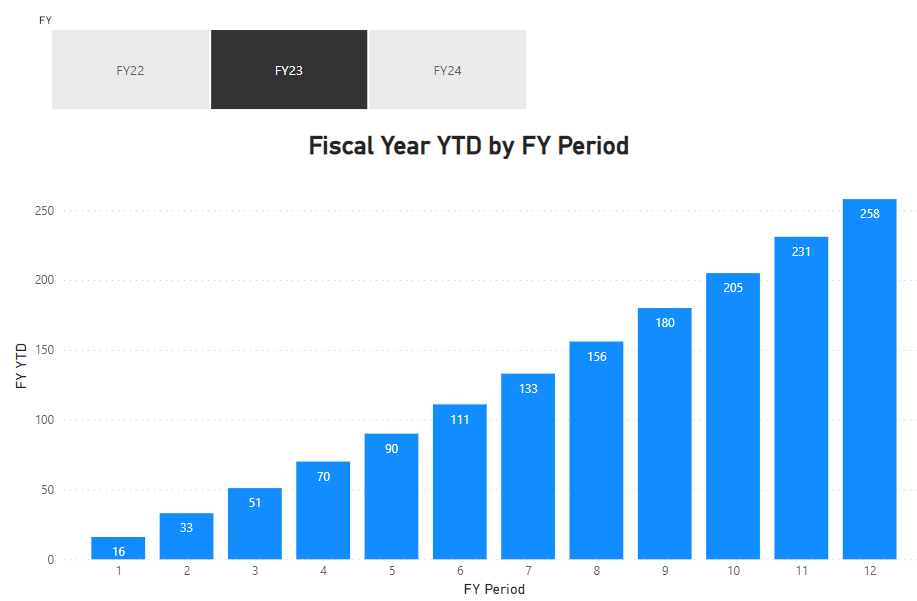
An example of reporting
I hope this helps you further.
Kind regards, Delta Select
2 Likes
Thanks a lot Delta for this support.
I have been able to create a separate the date table for time intelligence and am able to sort the measures based on the fiscal year calendar successfully.
But i still stuck in trying to recreate the matrix in the excel screenshot below
Thanks for your help
@wilford.mitchell ,
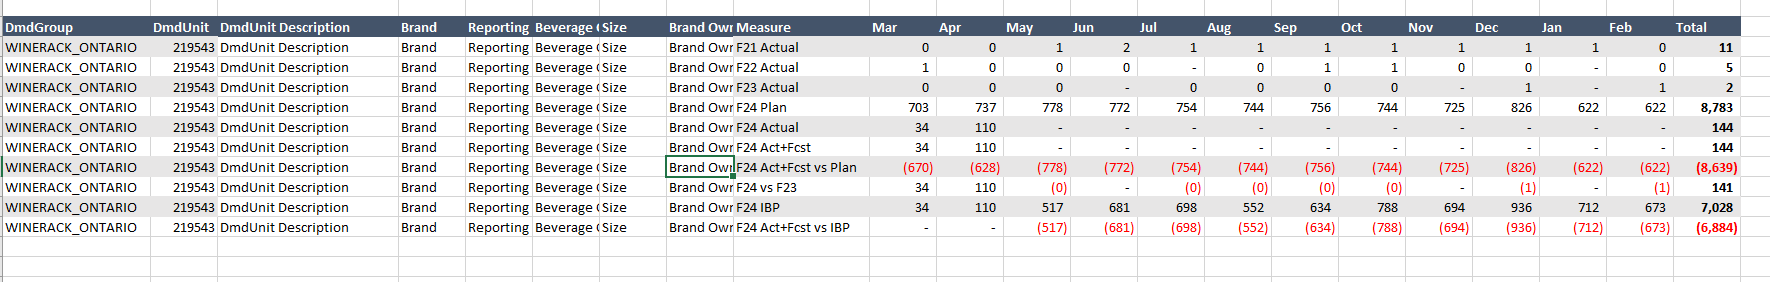
Apparently in Power BI measure values are presented in the columns : when using the 12 months in the columns with two measures, 24 columns appear, within the Matrix and Table form.
I am not aware of a possibility to present measure-values in rows instead, so I am afraid not able to help you further. Could you alternatively use the Power BI graphics ?
KR Delta Select
1 Like
@deltaselect The end users are used to viewing the visualization in matrix form. What Graphics do you have in mind.
Thanks
@wilford.mitchell
Just some thoughts: 12 months bar chart with actual vs budget, TTM (Take to make) in a gauge, norm being the FY FC, or using the drill down function to a next page/visual. Or using a dashboard with some KPI’s. In my opinion generally speaking : not too many information, less is more.
1 Like
Hello @wilford.mitchell
Did the responses above help solve your query?
If not, can you let us know where you’re stuck and what additional assistance you need?
If it did, please mark the answer as the SOLUTION by clicking the three dots beside Reply and then tick the check box beside SOLUTION
Thank you
Hello @deltaselect
We’ve noticed that no response was received from you on the post above.
Just following up if the response above help you solve your inquiry.
If it did, please mark his answer as the SOLUTION.
In case there won’t be any activity on it in the next few days, we’ll be tagging this post as Solved.
Hi @wilford.mitchell
Due to inactivity, we’d like to conclude that you no longer require assistance to solve your inquiry.
If you have a follow question or concern related to this topic, please remove the Solution tag first by clicking the three dots beside Reply and then untick the check box.