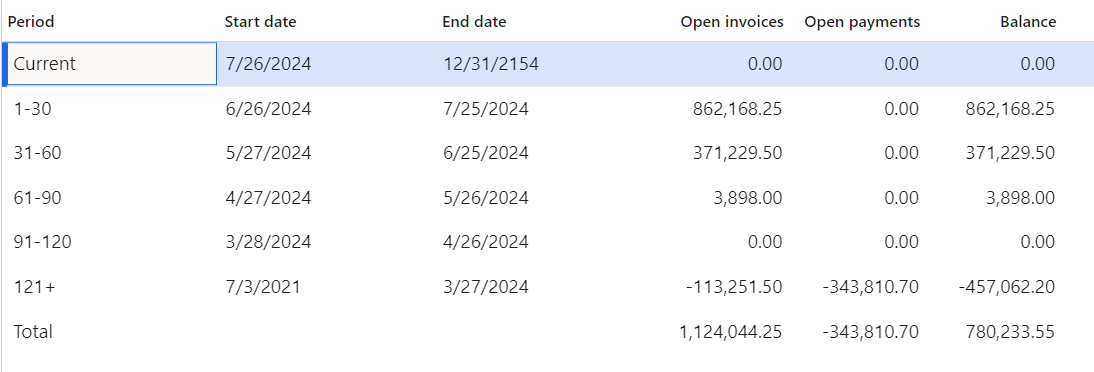
I’m currently working on D365 customer transactions (CustTrans). I’ve attached a screenshot of the aging period balance report generated in D365 F&O, which I’m trying to replicate in Power BI.
Despite following numerous guides on AR aging analysis, I haven’t achieved the desired results. My aging groups in Power BI don’t match the D365 report. I’m unable to distinguish between paid and unpaid invoices, as paid invoices aren’t cleared from the customer’s account. Consequently, the total of all amounts equals the outstanding balance.
I’ve included sample Excel and Power BI files demonstrating my current progress. Any assistance in resolving this issue would be greatly appreciated.
If you are unable to distinguished between paid and unpaid invoices, how are we suppose get that answer?
What does “NULL” mean in the data?
Can you go back to that report and ask for the logic(programming) that is involved in the report from the IT Support? This will help you to ensure all the information is collected. Databases(tables) that is involved in that report.
I have a feeling that you are missing an important table/s.
Thank you for your response @Keith AR_Sample.xlsx (59.2 KB)
. Based on my understanding, these transactions likely represent payments received or other adjustments to the customer’s account. I’ve added a new field to the Excel file (please see attached) for further analysis. Payments are often made in lump sums and applied to clear outstanding invoices. However, the issue is that paid invoices aren’t being explicitly marked as cleared, leaving a mix of paid and unpaid invoices in the customer’s account. While I’m familiar with invoice clearing processes in SAP, I’m unsure how this is handled in D365. The previously added TransType_$Label field was misleading and therefore excluded from the initial post.
Understanding how the report is created in d365 is my point. If you don’t know how the “NULL” component is created and in my opinion you are going around in circles.
Going back to the D365 IT support looking for the logic on how that report is created would be my starting point and getting that raw data to create that report in power bi.
The null values represent invoices that can be filled with any values. Dates and values needed to compute the AR grouping for the desired output do not contain null values.
It’s been a while since I worked on D365 but I think you also need to look at CustTransOpen. These include any of the activity on currently open invoices. So if you have an open invoice with £100 and a payment of £50 has been made, that will appear in CustTransOpen and you can use that to show outstanding debt. CustTrans will just show the original £100.
@TimPhillips Thank you for your feedback. I do not have access to the D365 VM, and the CustTransOpen view or table is absent from the database. I will discuss potential options for including it with the administrator.
If you haven’t come across it AxErd Home (alexdmeyer.com) this is a useful site for showing how all the different tables/entities relate to one another. Closest thing to a ERD we’ve found.