Hello!
I’m running into an issue when attempting to have two dynamic slider filters apply to multiple visuals.
High level, the report is presenting 6 weeks worth of “forecast” data and comparing two forecast projections, “Total System Forecast” and “Total Forecast” at the week level. There is a date slicer at the top representing the 6 selectable weeks. When no week is selected, the report should be evaluating the filter condition at the individual week level, across all 6 weeks.
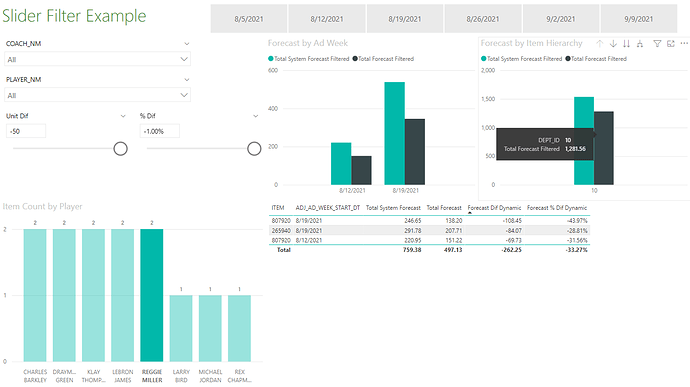
Data Table - Presents the item, week, total system forecast, total forecast, unit difference between the forecasts, and % difference between the forecasts.
Item Count By Player - Bar chart returns count of distinct items meeting BOTH of the slider filter conditions.
Forecast by Ad Week - Bar chart returns the total system forecast and total forecast aggregations meeting BOTH slider criteria by week.
Forecast by Item Hierarchy - Bar chart SHOULD return the total system forecast and total forecast aggregations meeting BOTH slider criteria by item hierarchy level.
Problem: When no week is selected in week slicer, the total forecast values within the table totals, forecast by ad week, and forecast by item hierarchy do NOT add up. When a week is selected, all works well. I believe the problem is the Forecast by Item Hierarchy has no understanding of week in the context, so it’s evaluating the measure conditions across the entire 6 week period and returning the total forecast meeting the slider conditions within that context.
What do I need to do to get the Forecast by Item Hierarchy total forecast align with the other visuals when none of the 6 weeks are selected within slicer?
I’ve attached an example .pbix showing the issue. There’s an “Issue Replicated” bookmark.
In this example, the total forecast in the table (497.13) aligns with the total forecast presented in the Total Forecast by Ad Week bar chart when summing the week totals (151.22 + 345.91), but does not align with the total forecast displayed within the Forecast by Item Hierarchy bar chart (1281.56).
Thanks in advance for the assistance!
MK
Slider_Filter_Example.pbix (663.9 KB)
