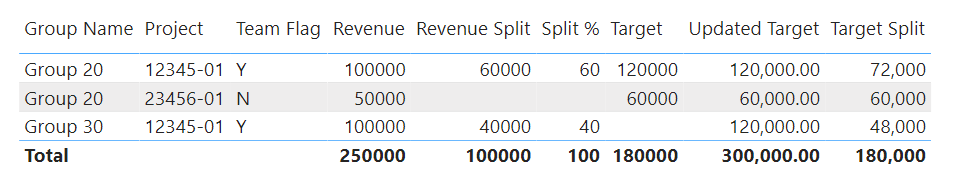
My example dataset contains two projects of the same number or id. That represents a split of their financial measures between the two rows based on a “Split %” amount. However, the source does not split amounts for one column (Target); where the project’s target amount exists on only one project row.
notes: Project + Group make for a unique row in the source table, and a Project-Group may have upto five splits (ex. five groups associated to the project of 20% each) or no split at all (where the Team Flag = “N” and no ‘Split %’ value exists).
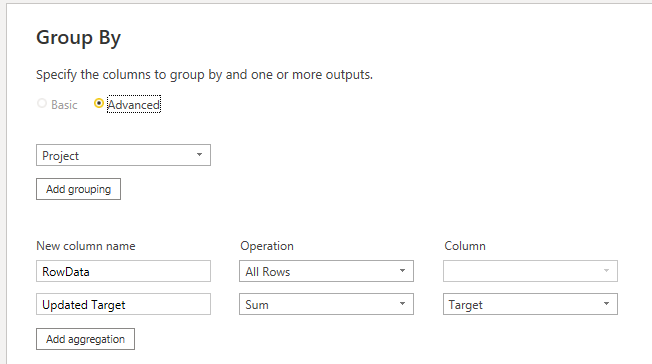
How would you recommend being able to calculate the split target amounts (60% of 120k in its project-group row and 40% of 120k in the other row) as a new column, and apply it to the table visualization shown?
Addressing the issue at the source is not a short-term option. EDNA - Apply Value to Rows.pbix (28.8 KB) EDNA - Apply Value to Rows.xlsx (8.8 KB)
There’s two more items I’d like to learn from you or our forum colleagues.
I’ve attached a truer representation of my source data where a monthly period exists (i.e. a deeper grain of the source table). You effectively disabled the Get Data source from your solution pbix… how did you do that, and how do you re-enable the attached updated source file?
The original “Split %” column is no longer a single column and I’ve labelled it “IGNORE”. The “Split %” by group is now reflected in five “column pairs” consisting of “Split Grp #” and “Split Group # %”. Thus, the Split Target amount (column) would be calculated based on matching the Project, Group (column B) and Period Start Date with the Split Group # value found in one of the five columns and using the adjacent (corresponding) Split Grp # % in the Split Target calculation.
note: Like several source columns, the series of five column pairs for Splits exist on each row of the Project-Group-Period Start. Sorry for that complexity, but I thought it to be way too much to originally explain in one item.
I’m confident what you’ve already built is usable, and seeing the initial solution is super helpful.
The updated source file is attached. FYI, the “Group” values are no longer numeric, but will match.
It’s great to know that you are making progress with your query @kkieger. Please don’t forget if your question has been answered within the forum it is important to mark your thread as ‘solved’. We request you to kindly take time to answer the Enterprise DNA Forum User Experience Survey, We hope you’ll give your insights on how we can further improve the Support forum. Thanks!
I have checked the Solution box on Heather’s response as it answered specifically what I asked. I remain hopeful to get a response/solution on the more complex source data & logic I provided as follow-up.
To answer your first question, I was simplifying the data model by just copying the table into the PBIX file. (At first I did not notice that you had provided the source file, and without that file I could not have edited the solution - so it was an un-needed work around )
As for point #2, I will not be able to tackle this until I’m done with my 8-5 job (sorry) - if you need a faster solution, you may want to either re-open this topic (un-check the solution box), or open a new one to catch the attention of someone else in the forum, and link this topic to that one.
I believe your solution here is going to be to unpivot those group IDs and Percentages to make a longer table, or possibly even to split this into two tables (one for the Project/Group info, and then one for the Project/Split info) - but until I play with it a bit, I cannot tell you which would be better.
 )
)