Hello everyone,
Firstly, Happy and Prosperous 2021 to you all !!!
Problem
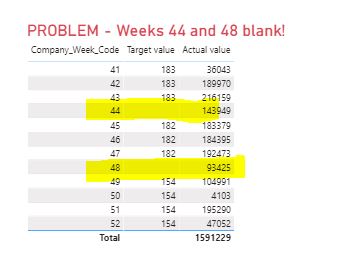
I have 3 columns in my table graph: Company Week | Target value | Actual value.
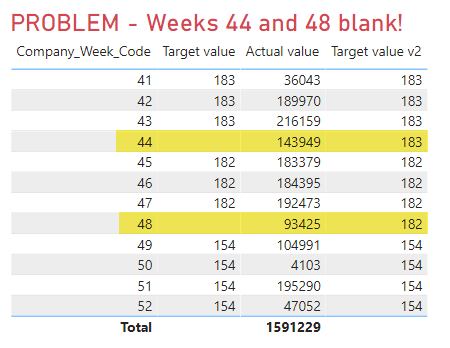
The Target value column is blank for week’s 44 and 48 (screenshot attached). For those weeks, I noticed that the date range falls between 2 months - a transition from one month to another.
Desired result
I would like to display data from the MIN(Month) ie. the first month of the two. So for my example attached, I want to have the value 183 showing for Week 44 and 182 showing for week 48. That is the part that I could not work out.
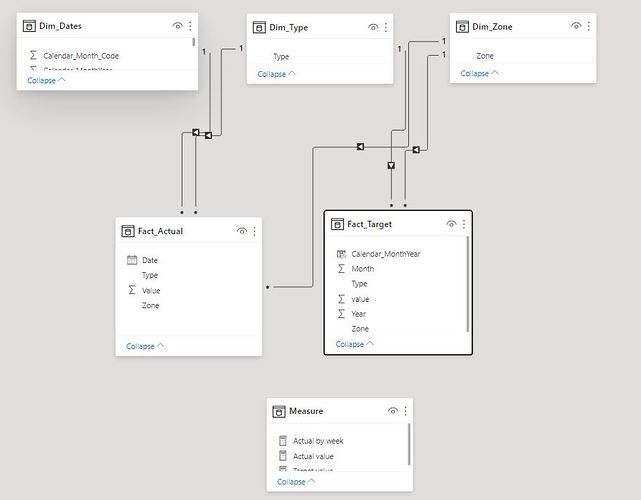
Description of the model
-
Company Week - Column from the Date dimension
-
Target Value - Column with following Dax calculation:
Target value =
CALCULATE (
SELECTEDVALUE(Fact_Target[value]),
TREATAS ( VALUES ( Dim_Dates[Calendar_MonthYear]), Fact_Target[Calendar_MonthYear])
)
The Fact_Target table’s grain is by Month. I used the TREATAS function to create a virtual relationship between the Date dimension and the fact table -
Actual value:
Actual value = SUM(Fact_Actual[Value])
The Fact_Actual table’s grain is by date. This table is joined directly to the Date dimension on the Date column.
Attached also is my pbix file.
Thanks in advance for your assistance,
 Different_Grain_Problem.pbix (76.4 KB)

