First of all, thank you. the courses were very informative.
I am new to the forum and also to power BI.
The data model I have is different so I am straggling here.
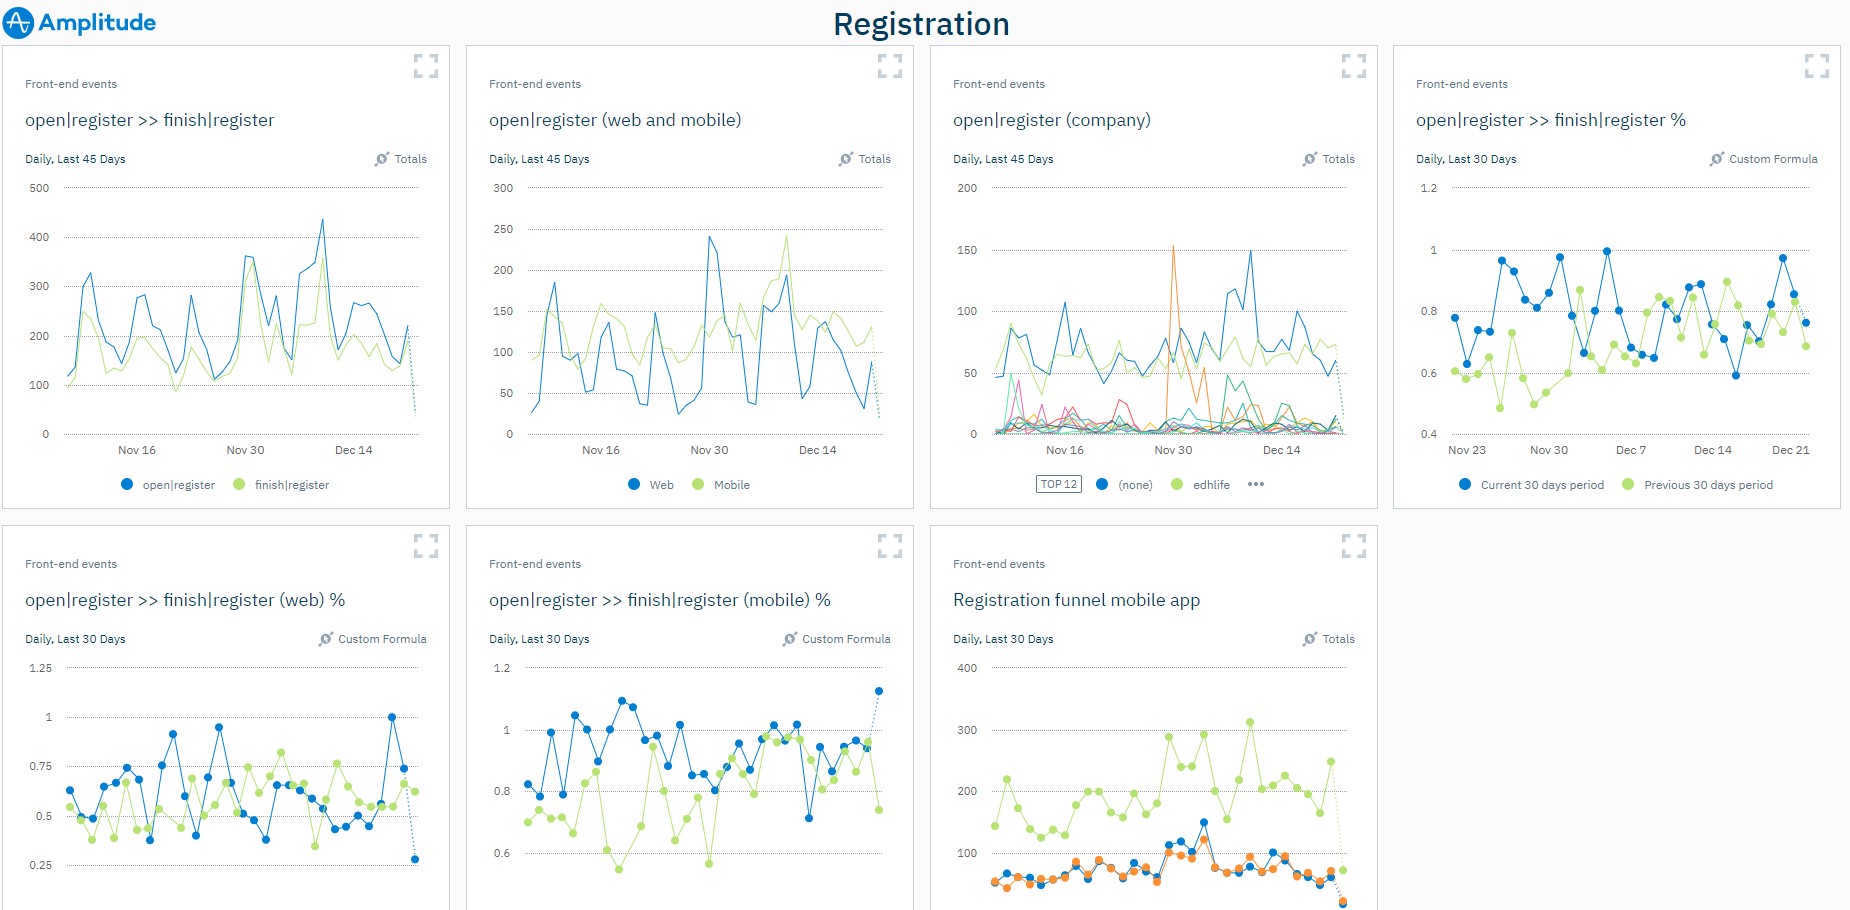
I am trying to shift all analytics from Amplitude analytics to Power Bi. and I need help write the DAX formula to what I need.
I need to count the number of users who open registration and who finished registration.
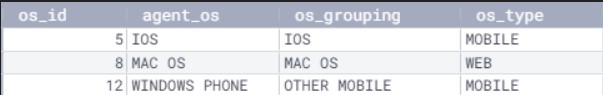
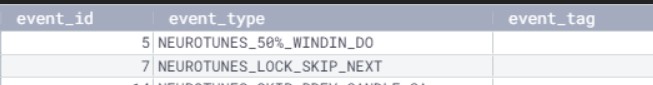
open registration and finished registration is under Event type where I will be measuring other events as well.
Hi @iasma, we aim to consistently improve the topics being posted on the forum to help you in getting a strong solution faster. While waiting for a response, here are some tips so you can get the most out of the forum and other Enterprise DNA resources.
Use the forum search to discover if your query has been asked before by another member.
When posting a topic with formula make sure that it is correctly formatted to preformatted text </>.
Use the proper category that best describes your topic
Provide as much context to a question as possible.
Include the masked demo pbix file, images of the entire scenario you are dealing with, screenshot of the data model, details of how you want to visualize a result, and any other supporting links and details.
Well can you please help us to categorize what actually conists as “Open Registration” and “Closed Registration” under the column Event Type under Event table because there are in total 761 different events listed under the Event Type and none of them matches as “Open Registration” and “Closed Registration”.
Please provide some more details here about what you’re trying to achieve and also which are the categories that will be taken into the account.
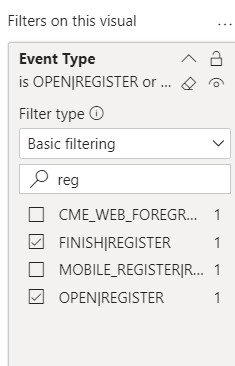
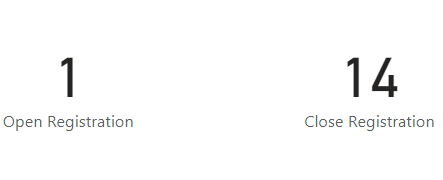
Thank You for the clarification of the categories. So based on the categories and conditions provided. Below are the formulas provided for the reference based on which you’ll be able to evaluate “Open Registration” and “Close Registration” -
Open Registration =
CALCULATE( COUNTROWS( 'Fact web Analytics' ) ,
    FILTER( Event ,
        Event[Event Type] = "OPEN|REGISTER" ) )


Close Registration =
CALCULATE( COUNTROWS( 'Fact web Analytics' ) ,
    FILTER( Event ,
        Event[Event Type] = "FINISH|REGISTER" ) )
Also attaching the working of the PBIX file for the reference.
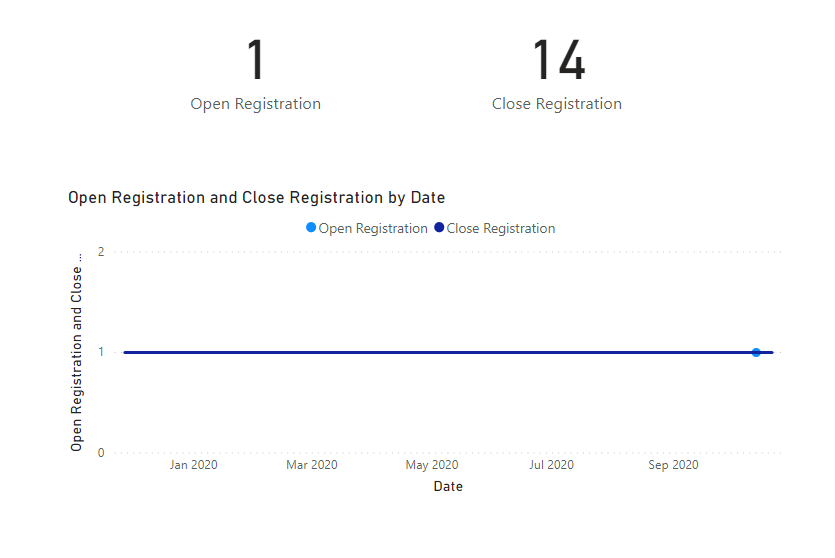
Since the results against the given categories are not enough it looks very plain. But this is how you can show it if you’ve more diversified data. Below is the screenshot as well as PBIX file provided for the reference -
I still don’t understand why its not showing any numbers for the registration, I am using the same data in amplitude. I don’t know if I need to do different calculation including the users or if my data model set right.
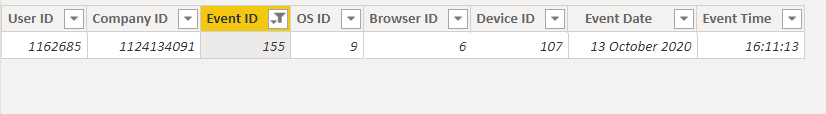
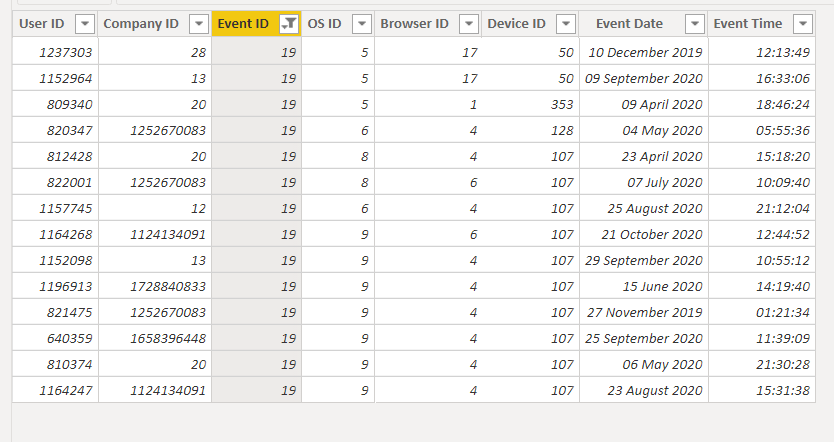
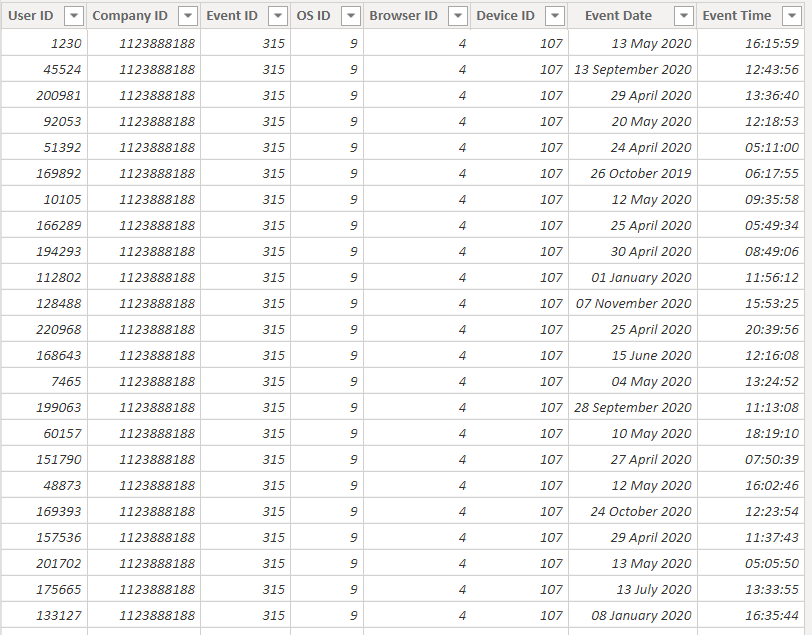
As per the conditions specified in the post, the Event ID for “OPEN|REGISTER” is 155 and for that only 1 row is available under the Web Analytics Table and for “FINISH|REGISTER” the Event ID is 19 against which only 14 rows are available under the Web Analytics Table. Below are the screenshots provided for the reference in order to to cross - check the results with the derived formula -