Amounts different when drilling through

https://drive.google.com/file/d/1W3Oz2Pat2VdMLRiLMvyH6Peu3CJid3hu/view?usp=sharing

In the above file,
when drilling into the year 2022 , for Jan , the amount is 2.51M
image

But if I drill into all the years, the amount is 7.57M for 2022 Jan

Any idea why this is happening?

Both are same, that’s just formatting issue, change the formatting from million to thousand.

Sorry ,wrong sample attached

https://drive.google.com/file/d/1W3Oz2Pat2VdMLRiLMvyH6Peu3CJid3hu/view?usp=sharing

image

HI @Anu,

This is because you are trying to see the date data horizontally where all the columns are not fitting as per information in the visual.


If you move the date to Rows field instead of column field you will get the correct result.

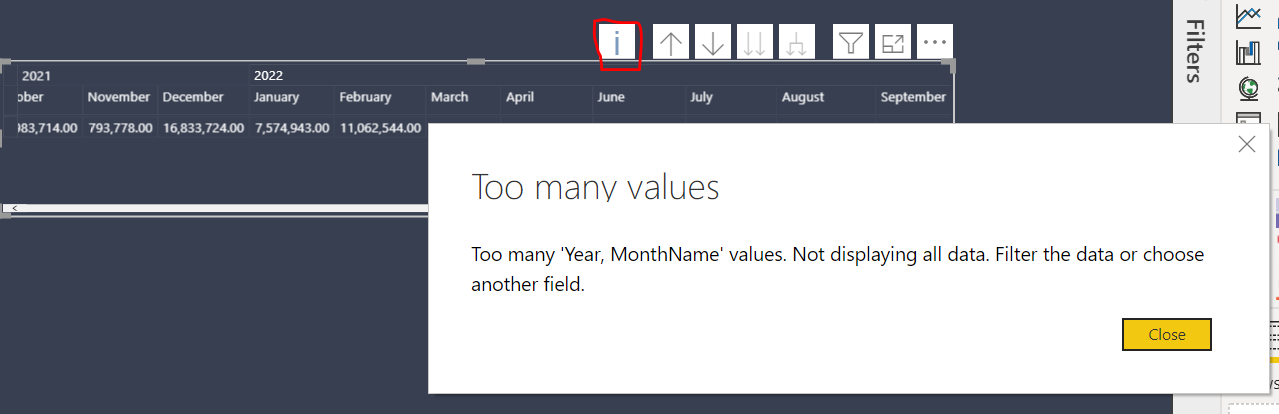
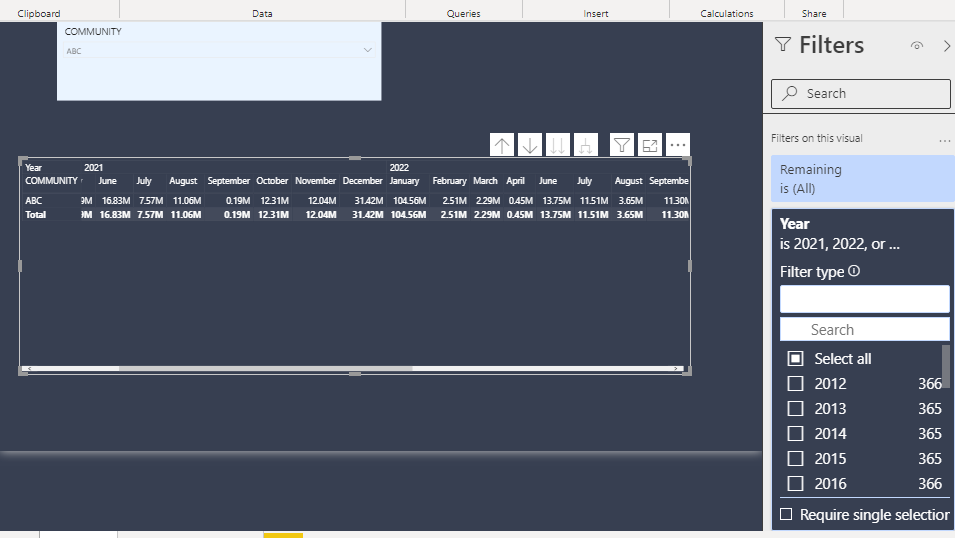
Are you sure it is because of “i”, and it is not fitting ?
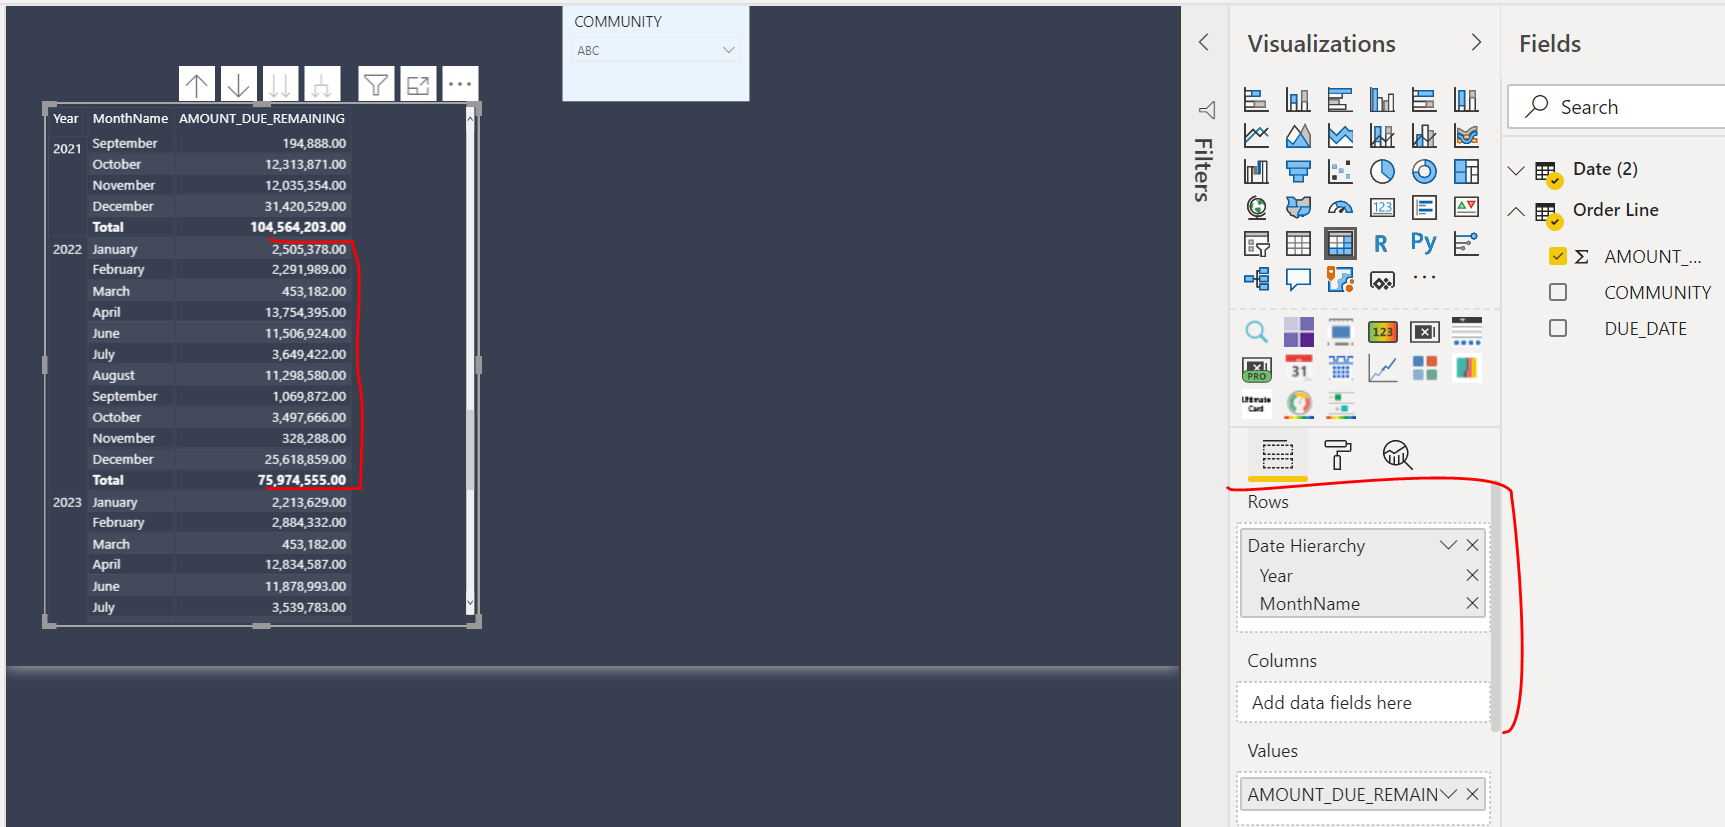
Even if i am applying a filter on year, and even when the “i” is not appearing(and everything is fitting), it is not matching.

@AntrikshSharma what is your opinion?

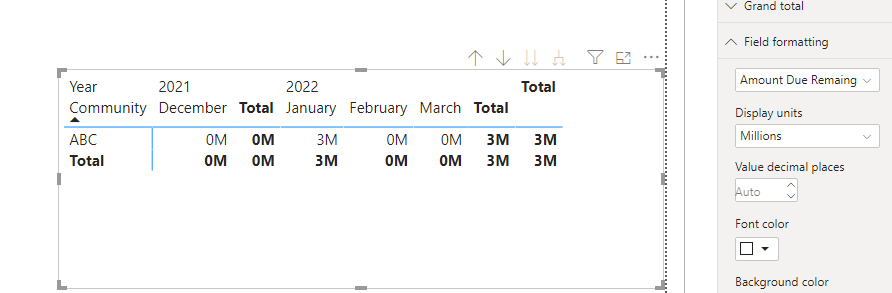
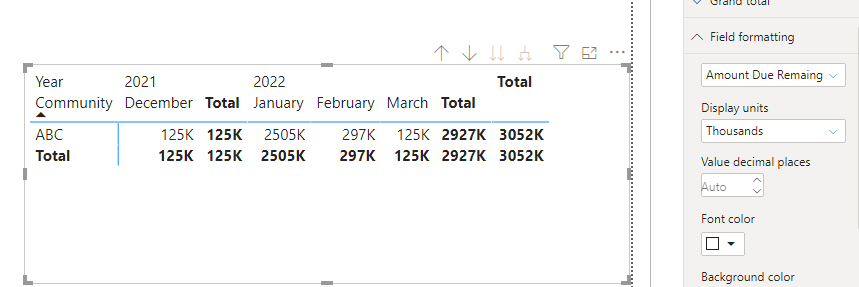
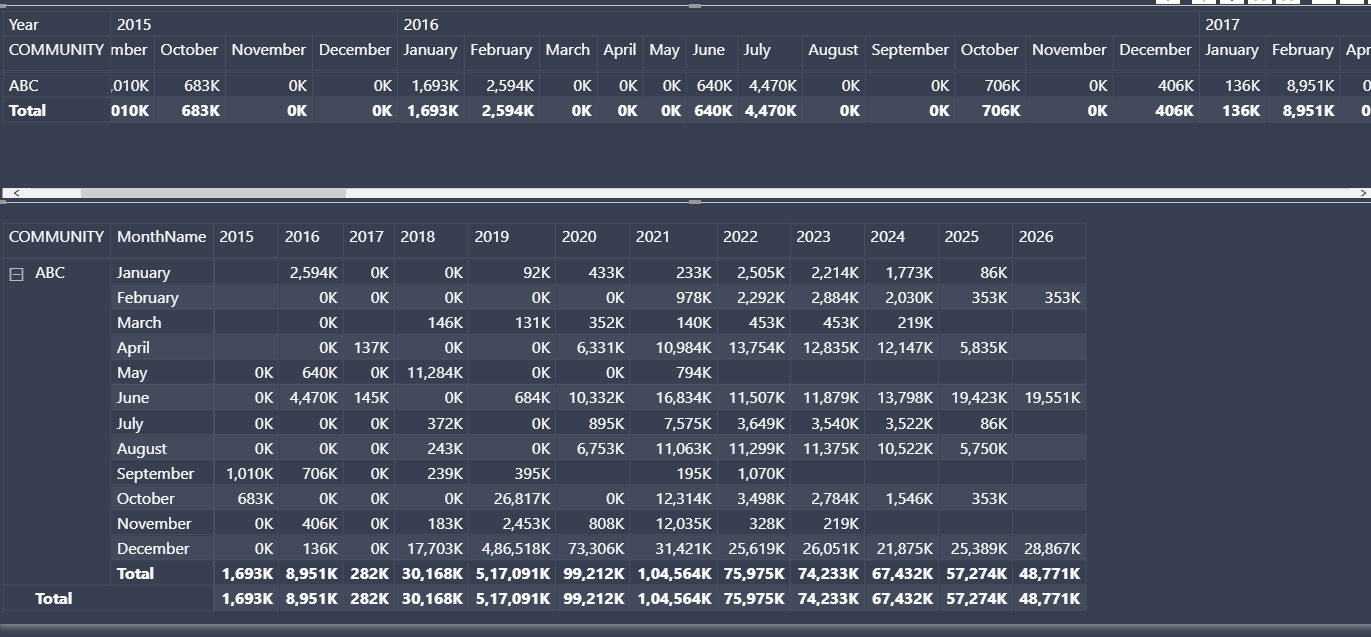
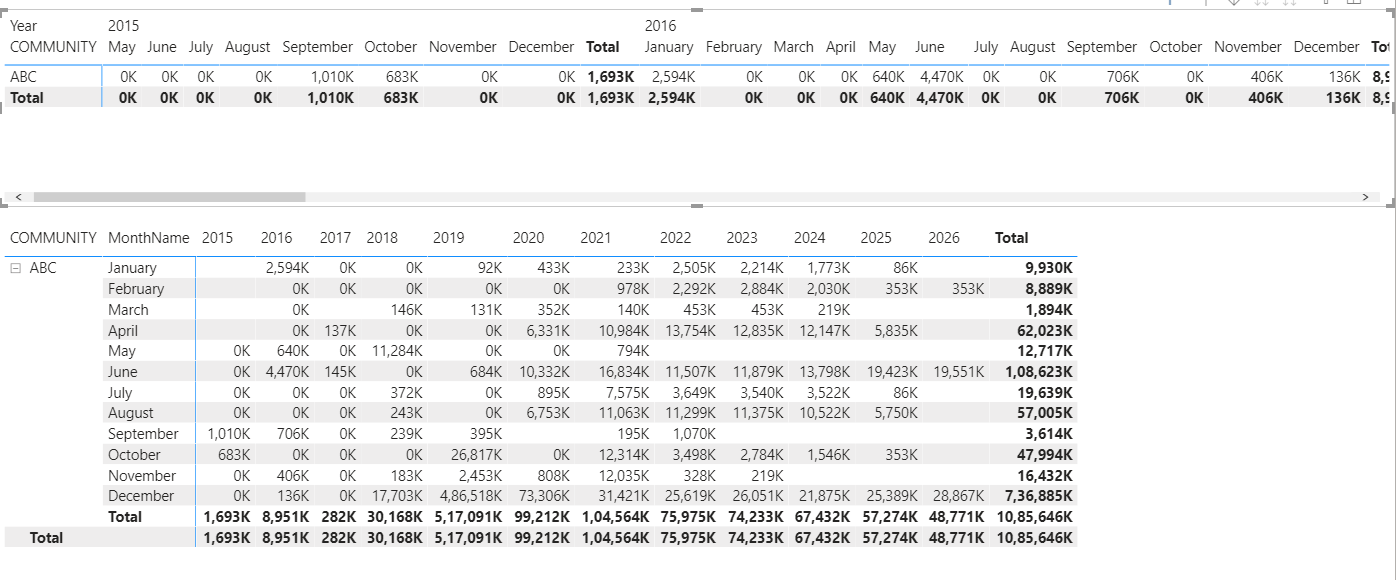
@Anu The current theme that you are using where did you get that? if I change that the results are correct. otherwise compare the below 2 tables and you will see that values are offset by 1 & -1

January 2016 shows the grand total of 2015
June 2016 shows the value of May 2016

after changing the theme:

1 Like

I am scratching my head so long on this, but how can a theme affect values in a table?

No idea, but could be that the theme has some bugs

When dates are on rows the result is correct.
When you drill down to only 2022 the result is correct

Hi @Anu , did the response provided by @AntrikshSharma help you solve your query? If not, how far did you get and what kind of help you need further? If yes, kindly mark the thread as solved. Thanks!

Yes it did help. But i still don’t understand why theme affects values in my table.