Allocate quarterly budget

Hi,

In my budget sheets I have sales by quarter
Q1-2019
Q2-2019
Q3-2019
Q4-2019
Then I want to split it out on a monthly granularity.
Jan 50% of Q1, Feb 25% of Q1 and Mar 25% of Q1. Then doing the same for the other quarters. Any suggestion of how I should do? I am trying With Cross Join but I dont get it to work.

Thanks
Hans

The key to this is to work out the budget allocation algorithm.

I’ve covered this a few times.

In theory if you have a quarterly number you need to divide this by 3 for months and then by 90-92 days if you want this at a daily level.

Here’s some links around this.

Check out the techniques used here. You will need something similar, with slight adjustments for quarterly numbers

Also check out this tutorial as well.

This is a key function that I think you’ll find very useful in this particular scenario.

And here another good example

If you can master the ideas and concepts here you’ll be able to solve for what you need.

If any questions on this let me know.

Also if you can add images of the data and model when completing these, that can really help also.

Chrs!

AllocationDNA.xlsx (10.1 KB)

Please find attached file. There you can see how I want it to be.

Thanks.

Best regards

Hans

Ok this is quite different and there’s quite a bit to it. Quite a unique scenario also. But also a really interesting one.

This is made a little more complicated by the Q3 breakdown. As it’s not generic, this needs special attention.

I actually covered a similar technique here at the recent learning summit

This used a very similar allocation methodology but was at a yearly level.

I got this into Power BI and created a model

You need to keep the data a bit more uniformed to get this to work.

Check out what I completed here

image

No 2019s in this table anymore. This way we are able to compare it to the allocation table on a like for like basis

I think I’ve been able to get it all going here

Answers seem to be coming through.

Check out the attached for the individual formulas. They are all pretty simple.

I use TREATAS once. This is a key function for this.

Attached
Allocate Quarterly Budgets.pbix (60.1 KB)

Hi,

Amazing, both for the answer and having the opportunity to ask an expert :smile:

Then I only need to figure out how to make sure the total sum in the column budget allocation gets correct. But I guess there is some video on that.

Again, thanks. I would never had figured it out by myself.

/Hans

Great.

Is the total not correct right now? It looks like it to me, so not too sure. Let me know.

The column Budget allocation sums up to 417. But the correct one should be 1000.

Are you sure it’s meant to be 1000 after the allocation percent is added to it?

It’s looks like to me after you take the budget breakdown and multiply that by the allocation percent you will get a lower number than 1000?

Are we comparing the same thing here?

Yes, I am sure. I only want to split out the budget to month, but the total should be the same. For client AA it is (100+200+20+80+30) = 430. But you are getting 179.

You have the correct numbers in Budget allocation column, except the sum amount in the end. If you sum up the numbers for client AAA it is:
50
25
25
100
50
50
20
56
24
15
8
8

431 (1 different due to rounding)

But you are getting 179 if you filter. On total level its should be 1000. I just want to splitt the budget into months.

Thanks.

Sorry my bad on this, I see the issue now.

Definitely the total is the problem here.

We need a formula that works a bit different to manage the total.

Try this to get the right total. I’ve kept the solution pretty simple but think it works well.

Budget Allocation = 
IF( HASONEVALUE( 'Time Frames'[Month] ),
    [Budget Breakdown] * [Allocation Percent],
        [Budget Breakdown] )

Let me know if this works for you

Chrs

Cool :smile:

It Works perfectley!!!

Many thanks.

One more question: Whaft if client AA have another Budget allocation than BB and CC, how should I do then?

You’ll probably have to work up an example for review on this.

To solve it will be a combination of the right model setup and also the correct DAX formula.

It brings in another aspect to the calculations that needs to be managed correctly. Will need to set the exact setup of the table to know what is the correct solution on this.

Thanks

Sure. Please find Attached file.AllocationDNA with client splitt.xlsx (10.9 KB)

The file you showed before worked Perfect, after the small formula change you also sent. I want the same except the allocation should be on Client Level.

Thanks.

Check out the update made to the attached

Allocate Quarterly Budgets.pbix (64.5 KB)

I think was quite easy in the end.

Just needed to add the updated allocations to the table that was already there and then join up the client table to the updated allocations table.

See below

image

This is the benefit of building a robust model like this.

All the formula seem to still work as they should with the additional information

image

Hi again,

Perfect. It Works!

I thougt that would make it possible for me to solve my problem, but not. I want to combine, in the same chart, actuals and Budget and use Your date table. But I have some problems:
a) How do I create a table that consists of both actuals and Budget clients. I think I should copy the actuals and Budget, then only use the Client column, then remove dublicates and the combine the two. But I dont get it to work when I am trying to use that table when visualizing ((It may also be due to some other problem that I dont know)
b) The actuals data sometimes dosent exist, making the table look strange.

I think there is more problems, but maybe its best I only upload the file and than you can try to fix it.

In the end I want to have different actuals years, like 2018 and 2019 (I know I am a bit early :slight_smile: ) and Budget in the same graph/column
Allocate Quarterly Budgetsv Version 2.pbix (169.1 KB)

Thanks

Ok yes,

So this again will require something different, and actually change it up quite a bit.

Make sure to check out all the mini series tutorials here. There’s nearly all budgeting techniques you can think all covered here

Your model here and the data within your tables will need to be more standardized to get this to work properly.

That’s the reality here.

There’s no special technique to solve it other than sorting out the data.

I’ve tried to work something up here but want you to have a think about how you can simplify things.

Personally I don’t like to put bandaids around the model and DAX formula, because it lifts the complexity of everything when you can just make simple change to your raw data.

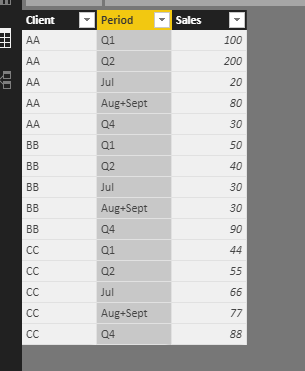
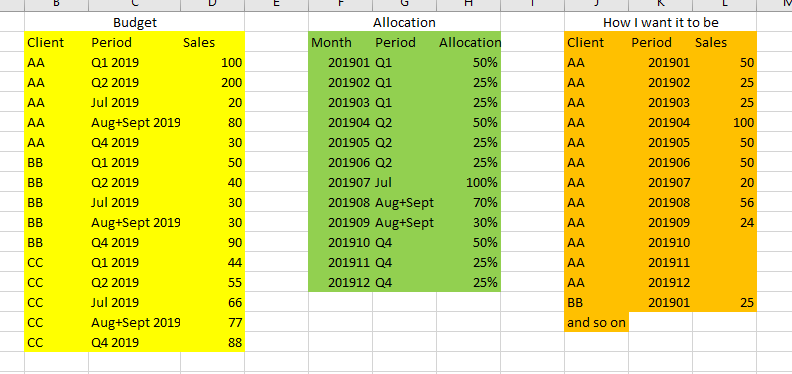
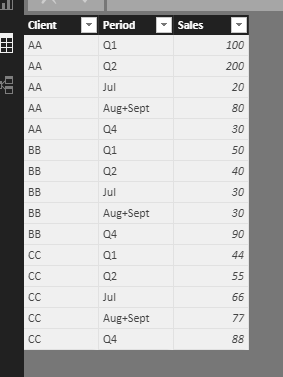
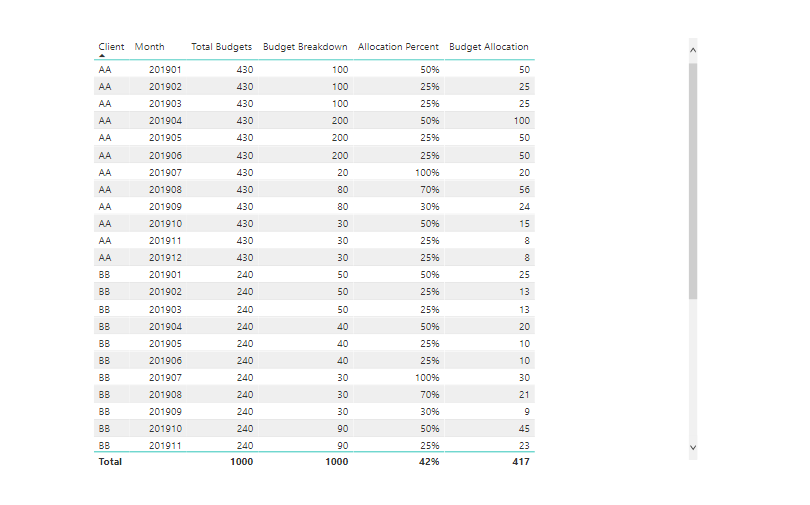
For example, this here should really be broken down by month

image

Then you can actually solve this very quickly using the techniques described in here

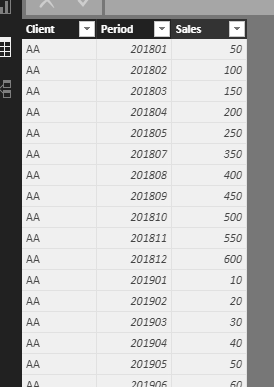
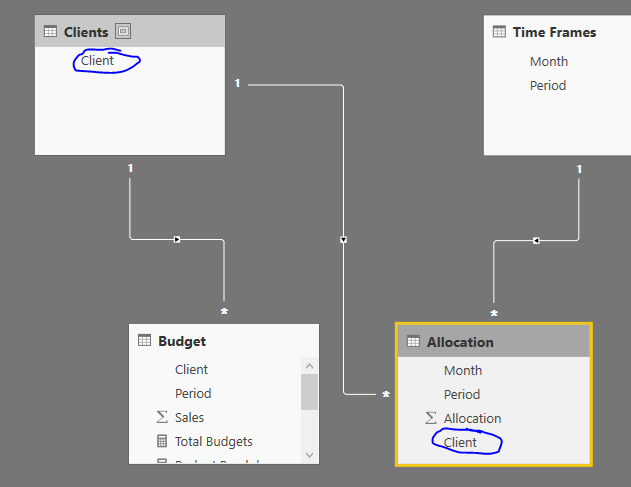
Within your actuals table you actually have a sound setup

image

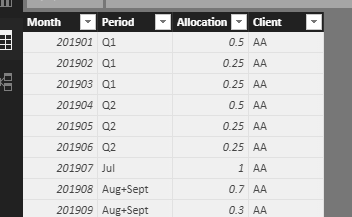
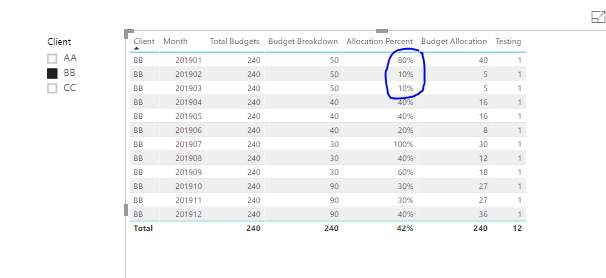
In your allocation table you already have a good monthly breakdown so that fine.

image

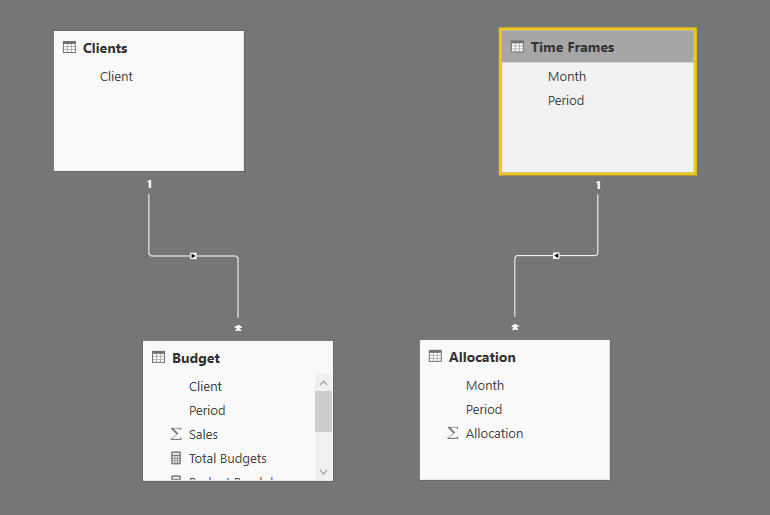
This idea to join up the date table in some way create a common column between all the key table here.

I believe it would be this one.

image

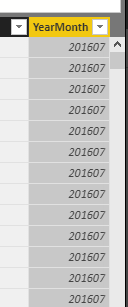
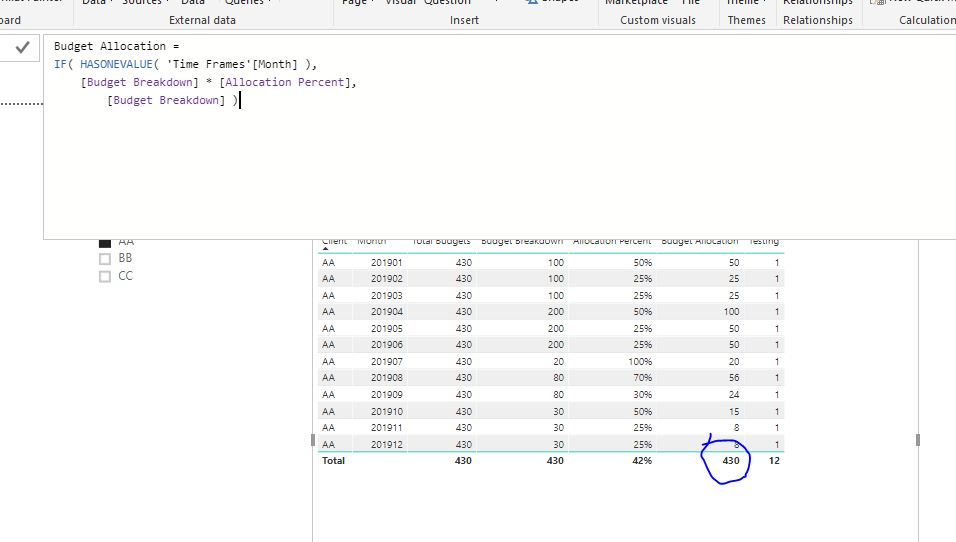
So the idea would be to get this into the date table somehow. You could do it simply with a calculated column like this

YearMonth = LEFT( Dates[MonthnYear], 6 )

image

With this we could then easily connect it to the other table using the TREATAS function.

So in summary the important thing here is to improve the data. This will make this 10 times easier to implement and understand.

Want to work on that first.

Then definitely check out the monthly allocation tutorial. The technique showcased there is how you would then ultimately solve this.

Chrs

Hi,

I think I finally got it :slight_smile:. But my problem now is that my column with sales contains several things. Lets say it is Products green, blue and red. So it is one more column named produtcts with different colors. Then I need to create several measures. In Your example its first Total Budgets, Budget breakdown, allocation percent (that one is the same), Budget allocation. The best thing for me would be if this one:
Budget Breakdown =
Budget Allocation =
IF( HASONEVALUE( ‘Time Frames’[Month] );
[Budget Breakdown] * [Allocation Percent];
[Budget Breakdown] )

could be filtered to for example green. Otherwise I need to create so many measures.

Any suggestion?

Thanks.

You need to solve this in the model.

Does your budget tables have this information in it also? If not then really there’s not much point in doing the below but if yes then you want to complete the below.

If you want to have filters that work across both tables concurrently, think about create a lookup table with just the colours in it and have that linked to the below sales and budget tables.

This way you can place the one filter and have both calculations filtering at the same time.

The concepts behind this are all detailed quite extensively in this course module below