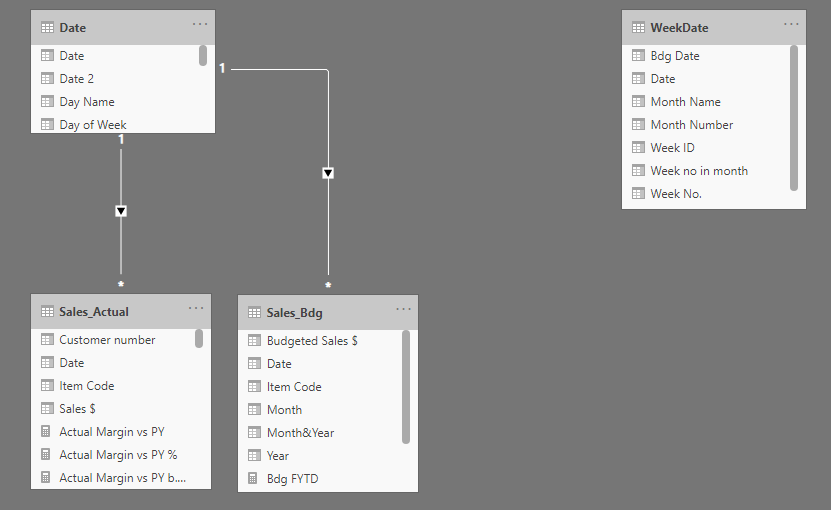
I have a power bi file where I have the Sales Budget table where the sales is allocated monthly on the last day of the month. I now need to allocate these to weekly level using the percentage allocation for each week based on previous FY. For this, I created a weekly time table which has date, month and weight% for each week of the month.
I tried SUMX and other formulas but all these give the weekly allocation only for the last week of the month and not across all the weeks.
My aim is to then create a variation analysis between sales budget and sales actual. My sales actual are at a daily level but I will have variation analysis at daily, weekly and monthly level.
Can someone please guide me on the correct methodology to use here?
I tried Sam’s logic for daily allocation and that works completely fine.
Attached pbix file as well.
Thanks,
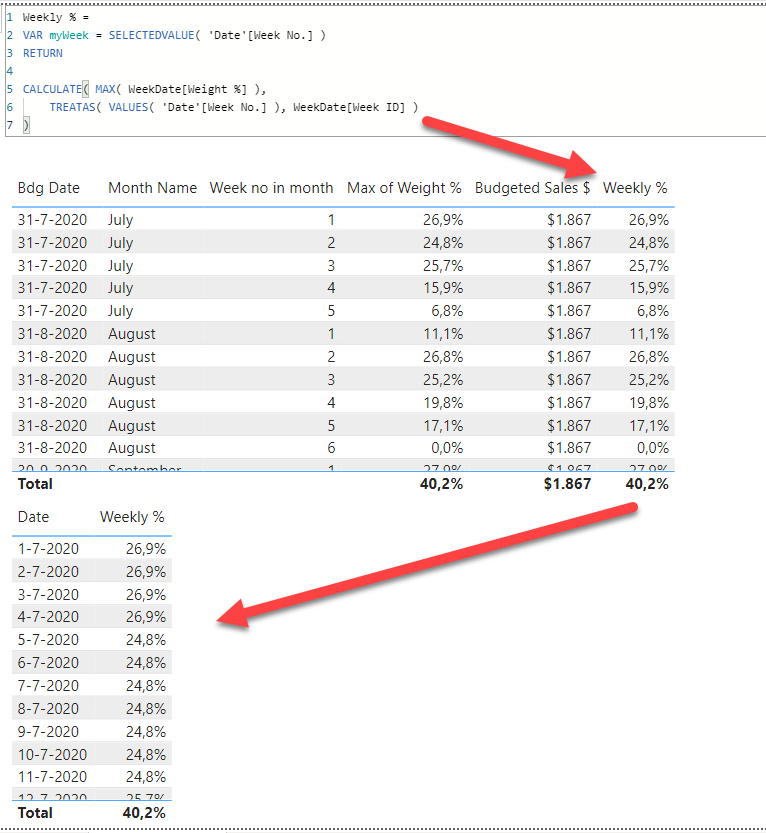
When placed in the table visual it produces the same result as the implicit measure. When placed in a table visual with a Date field on the rows it returns the same value for each day in that week.
If you need further assistance please provide a mock up of expected results.
Here’s your file: eDNA Weekly Sales Variation.pbix (1.3 MB)
Thank you for the solution.
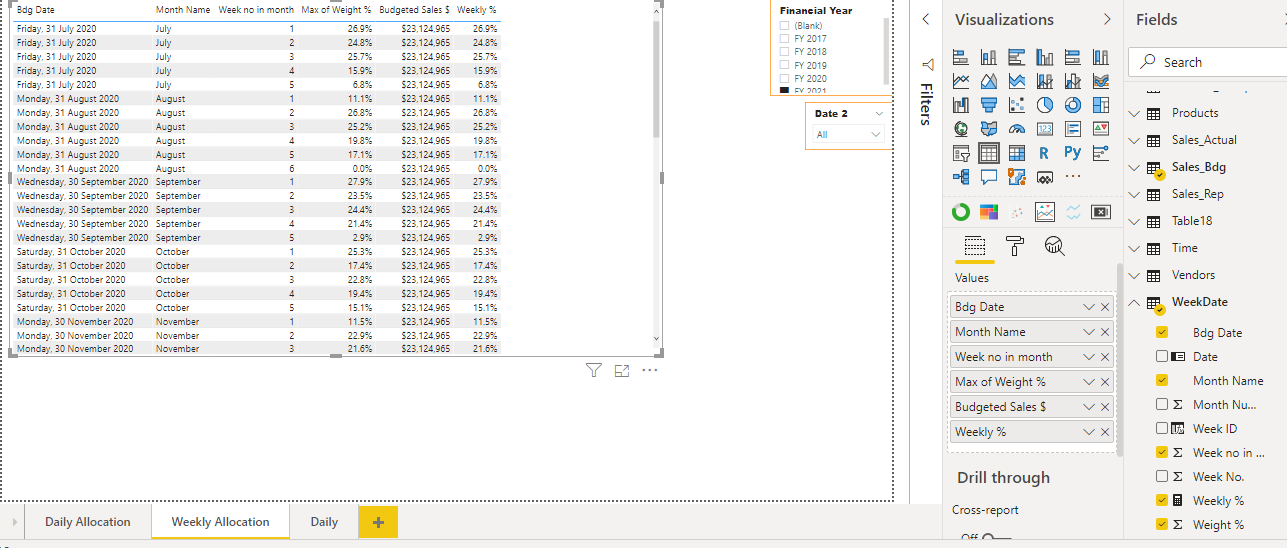
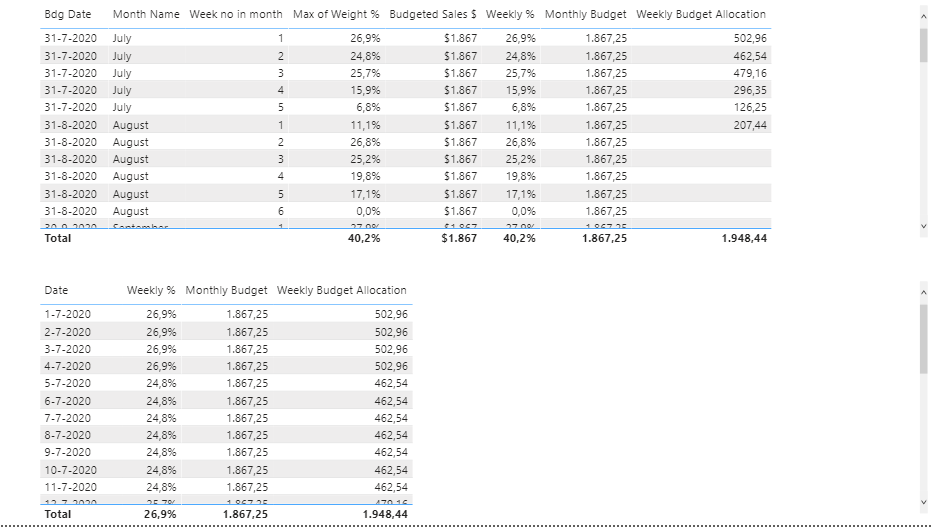
I did the above changes and applied to my model, however the sales budget value is the same across all weeks of the month rather than allocating it to the weeks based on the weight%.
My model is quite heavy so attached image to show you the results.
Hi @Nupur, did the response provided by @Melissa help you solve your query? If not, how far did you get and what kind of help you need further? If yes, kindly mark the thread as solved. Thanks!
I tried your steps mentioned and corrected my percentage allocation as well.
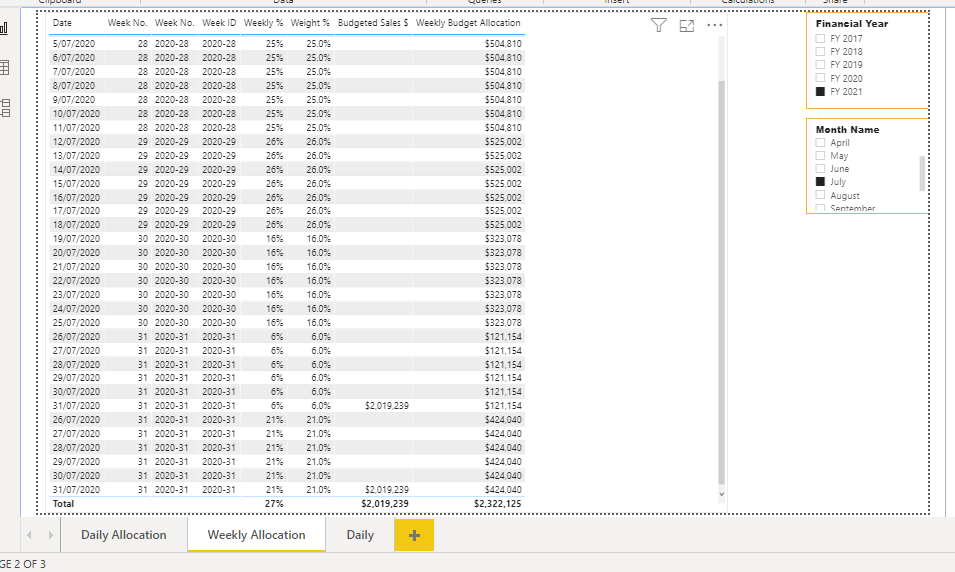
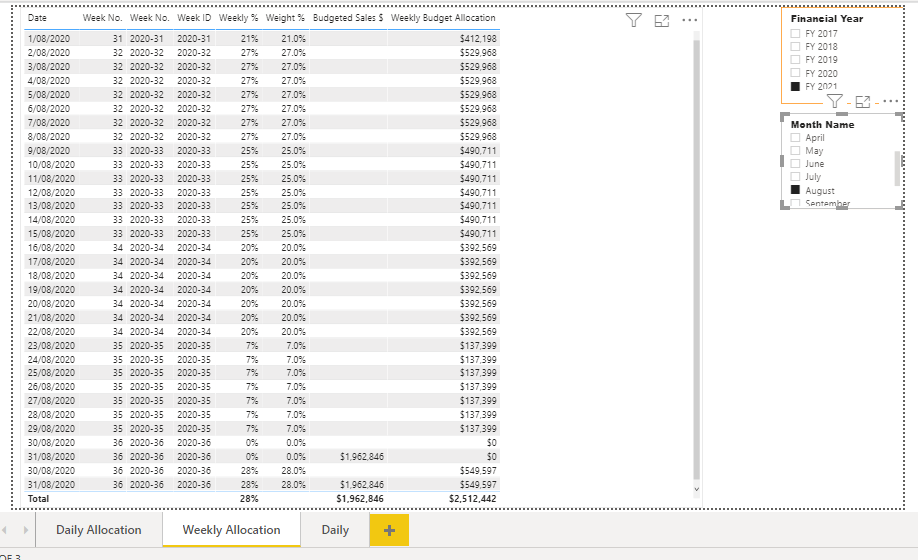
A new issue now! The last week for each month is replicating twice and it takes the allocation two times!
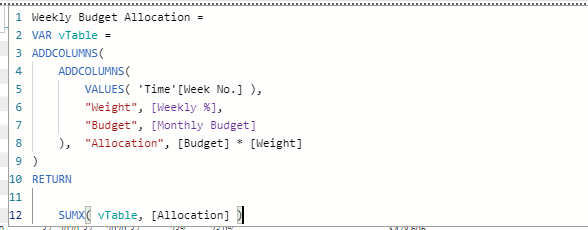
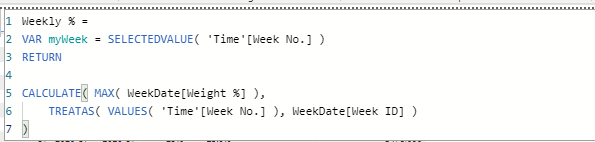
For example: Last week of July should take 6% only while it’s taking 6% and also 21% for last week I have also attached snippet for August where again it’s replicating values for last week twice. Can you please advice on this. This is getting on my head now… Thanks again for your help. Attached formulas used as well.
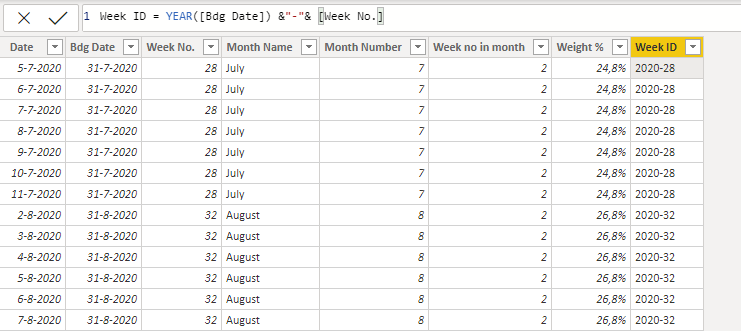
If that is the case we need to rebuilt the Week identifier so it’s unique to each Week in Month and Year. I’d go for a large integer you can built that easily in Power Query, just add a Custom Colum and enter something like:
This should do it.
Just incorporated a unique week identifier that couldn’t spill over into other months. [Year] * 10000 + [MonthOfYear] * 100 + [WeekOfMonth]
And applied the same measures over that new dimension.
Hi @Nupur, did the response provided by @Melissa help you solve your query? If not, how far did you get and what kind of help you need further? If yes, kindly mark the thread as solved. Thanks!