Advice on Massive Data Model with 30+ tables

I inherited a massive data model, which was created by a data consultancy firm no longer working with my client.

Basically, the consultancy firm brought every data table relevant to the business (from a CRM, appointment manager, call center software, financial software, etc.). This includes 10 or so fact tables ( each with 100,000+ rows), along with over a dozen dimension tables (including 6+ date tables to filter all the fact tables). Here’s a screenshot of the data model that I inherited:

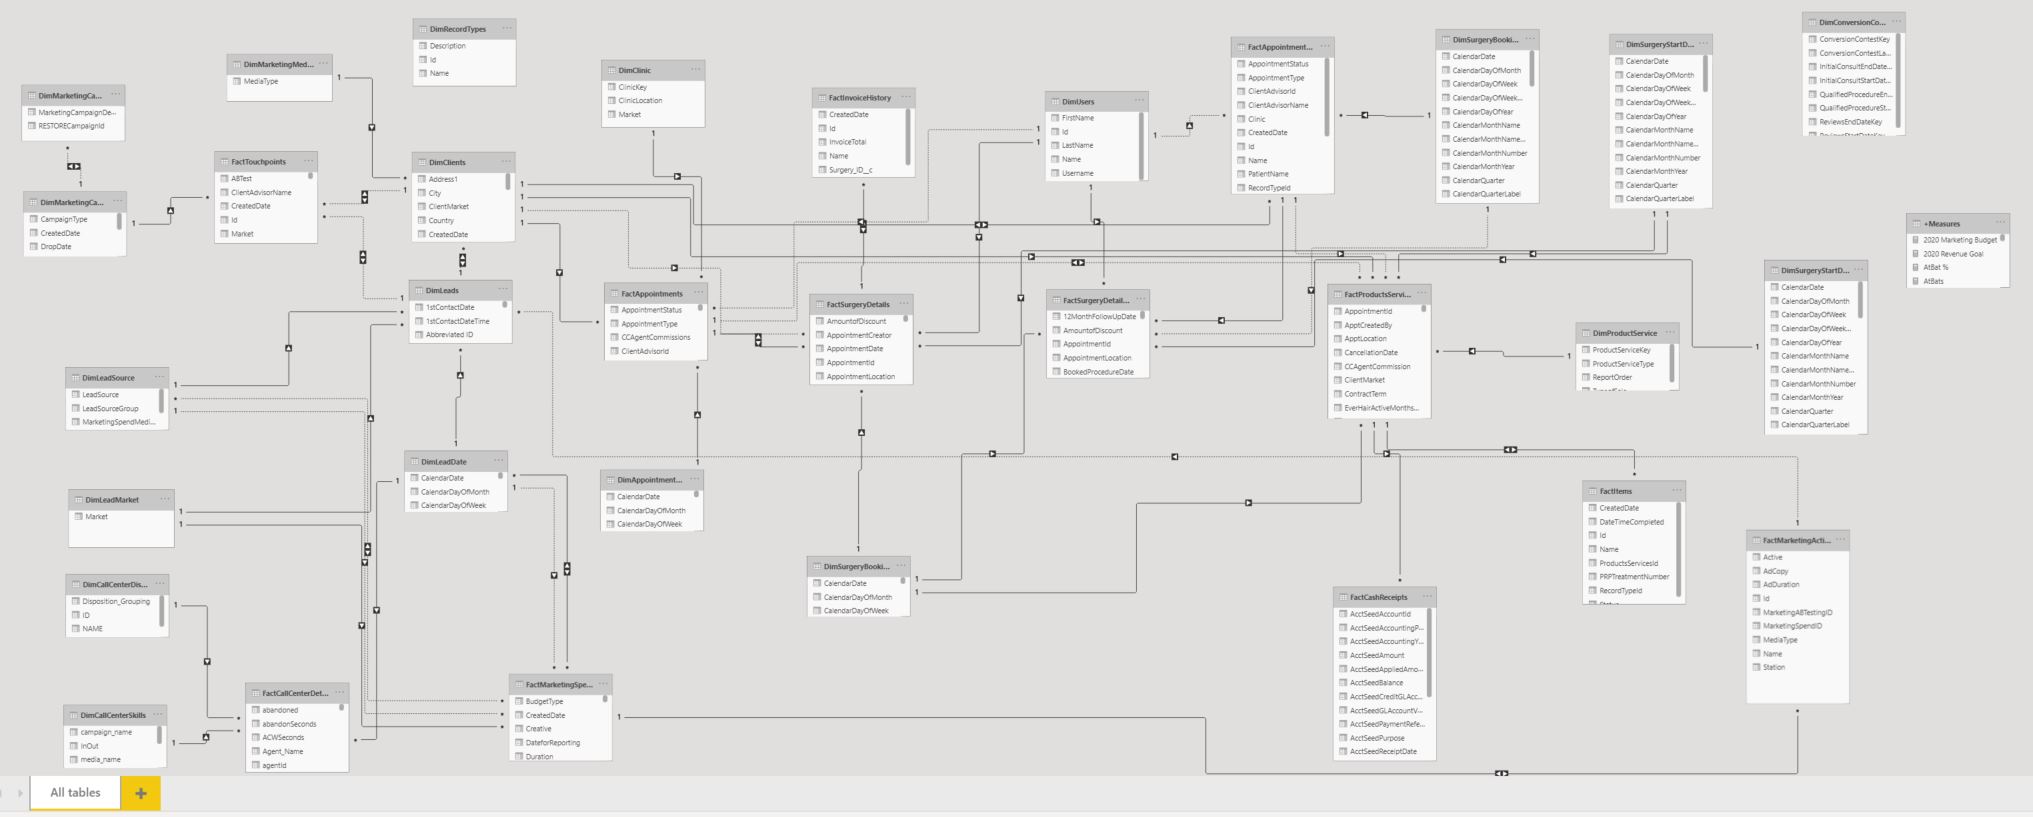
This same consultancy firm went on to create numerous dashboards in Power BI, setting up a hundred or so relationships between the tables, some active, many inactive due to circular redundancy.

Each dashboard on its own uses only a fraction of the tables stored in the model. For example, there is a sales dashboard, which uses the fact tables and dimension tables related to sales (while ignoring all the other tables that contain call center data, appointment data, or marketing data, for example). There is also a call center dashboard, which uses only the tables related to the call center, while ignoring the other tables.

This means that there is a huge amount of data sitting unused in the data model when looking at each individual dashboard. Whiel each dashboard references 6-7 tables, the remaining 20 tables are sitting in the model unused.

Due to the sheer size of all this data stored in these tables, Power BI is agonizingly slow. It takes 30 seconds, for example, to change the file location of a measure from a fact table to my measures folder. Another 30 seconds to click “create measure”, and another 30 seconds when you click “enter” to actually create the measure.

I’m wondering what are the best practices here? It seems to me to make more sense to upload ONLY the tables that are relevant to the dashboard/visualizations being built, and to delete the rest from the model so they don’t slow everything else down.

What would be the benefit of keeping all the data tables available all the time, even if they aren’t being used by a particular report?

Thanks,
Pete

@pete.langlois,

I’m wondering what are the best practices here? It seems to me to make more sense to upload ONLY the tables that are relevant to the dashboard/visualizations being built, and to delete the rest from the model so they don’t slow everything else down.

Bingo! Not only bring over the tables that are relevant to the report being built, but if possible only bring over the fields within those tables you will need.

Your contractor seemed to have been following a “worst practices” handbook. Not only is this data model impossible to follow, inefficient and full of circular references, but the frequent use of bidirectional relationships almost certainly means that there is ambiguity within the model and thus that the numbers coming out of it can’t be trusted.

Unfortunately, my advice would be to burn this to the ground and start over using the approach you cite.

  • Brian
1 Like

I do agree with BrianJ,
start from the basic.
The stakehoder requirements and which are the key parameters (KPIs) the business need to monitor to stear the enterprise into the right path.
The good of power BI is to allow the users to been able to develop the most appropriate dashboard.
How better than the employee that breath the business on daily basis knows what is required to keep it on track.

My experience with big consulting firms that were supposed to provide us some add value was …

  • they tend to over complicate all, to keep them on the fee
  • hire new people most of the time without the required experience to perform the job
  • charge a lot of money
    but they are very good in selling smoke to the executive management and let the emplyee to strugle with an almost not working model.

Of course I do not want to generalise, but …

lb

2 Likes

Hi Pete,

In the past, when I was faced with rows and columns of tables, I felt like I needed to acquire a better understanding of what was in each table before I could start deleting tables and only using what I needed. This is what I did, and it seems a little backwards than normal, but I feel I came out with a much better understanding of the information in each table and how I could get rid of the excess and utilize the tables to the best of my ability.

Sam taught us to organize the tables with the dimension tables in the first row and the fact tables in the second row. I opened a second Power Bi, so I had the original chaos on one screen and the other on the second screen; like Sam said to do, I then deleted all the relationships and organized the tables into their appropriate rows. Then, I started recreating the dashboards that were in the old Power Bi on the first screen, recreating the relationships as needed in the tables while thinking through the measure.

From the sounds of this, it will be a bit tedious. However, this is so large, and because it was inherited, anything will be tedious. After doing this with my own inherited data and implementing what I had learned about using measures and organizing the data, I not only had a clear understanding of what I was working with, but the dashboards were able to perform significantly much better.

Good Luck!
@brandyemurray

2 Likes