Adjusted Forecast

Hello:

My question is a bit different than what I’ve seen posted. I am trying to use the production figures for each month where production occurs. Even if it is 9-04-2020 with only a few days of production, I’d like to keep the entire September production as part of the rebalanced forecast, adding the forecast amounts beginning in October.

I’ve played with this to the point of having to ask for help.

Any input is appreciate and I’ll attach the example file for your reference.

Thank you,

Bill S.FC Production plus FC.pbix (104.3 KB)

Hi @Whitewater100,

Can you provide a mock up of the desired results in excel for example?
That will be helpful.

Hi Melissa:

Yes and thank you for looking at this for me. Oct-Dec would be the forecasted amounts. Please see attached.

Best regards,

BillProd_FC w results.xlsx (16.7 KB)

Hi @Whitewater100,

Could you please help to include " entire September production as part of the rebalanced forecast, adding the forecast amounts beginning in October" scenario in your excel sheet to understand better.

Hi @Whitewater100,

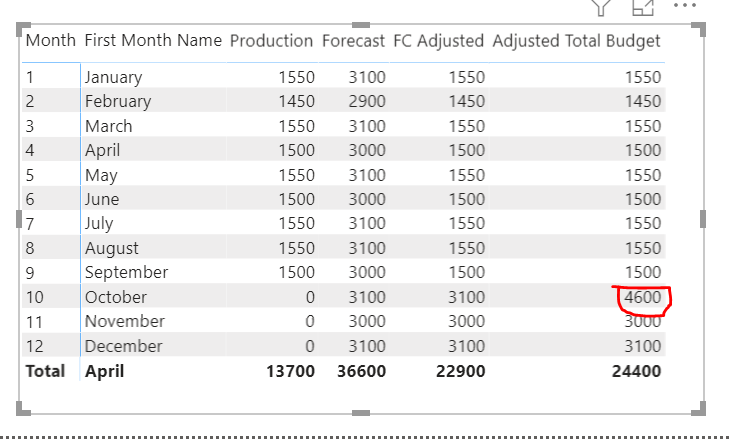
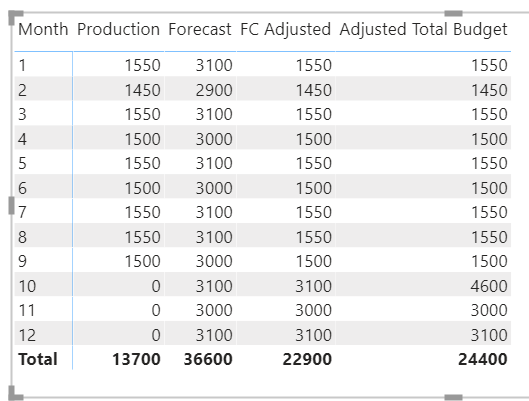
Are you looking for similar to below where the balance of September is getting carry forwarded to October. If yes then you can use Power Query to achieve the same.

let
    Source = Excel.Workbook(File.Contents("C:\Users\Desktop\Personal\DNA\FC_Support.xlsx"), null, true),
    Sheet1_Sheet = Source{[Item="Sheet1",Kind="Sheet"]}[Data],
    #"Promoted Headers" = Table.PromoteHeaders(Sheet1_Sheet, [PromoteAllScalars=true]),
    #"Changed Type" = Table.TransformColumnTypes(#"Promoted Headers",{{"Date", type date}, {"Production", Int64.Type}, {"Forecast", Int64.Type}}),
    #"Inserted Month Name" = Table.AddColumn(#"Changed Type", "Month Name", each Date.MonthName([Date]), type text),
    #"Grouped Rows" = Table.Group(#"Inserted Month Name", {"Month Name"}, {{"Forecast", each List.Sum([Forecast]), type nullable number}, {"Production", each List.Sum([Production]), type nullable number}}),
    #"Replaced Value" = Table.ReplaceValue(#"Grouped Rows",null,0,Replacer.ReplaceValue,{"Forecast", "Production"}),
    #"Added Custom" = Table.AddColumn(#"Replaced Value", "FC Adjusted", each [Forecast] - [Production], Int64.Type),
    #"Added Index" = Table.AddIndexColumn(#"Added Custom", "Index", 0, 1, Int64.Type),
    #"Added Custom1" = Table.AddColumn(#"Added Index", "Temp", each #"Added Index"{[Index]-1}[Production], Int64.Type),
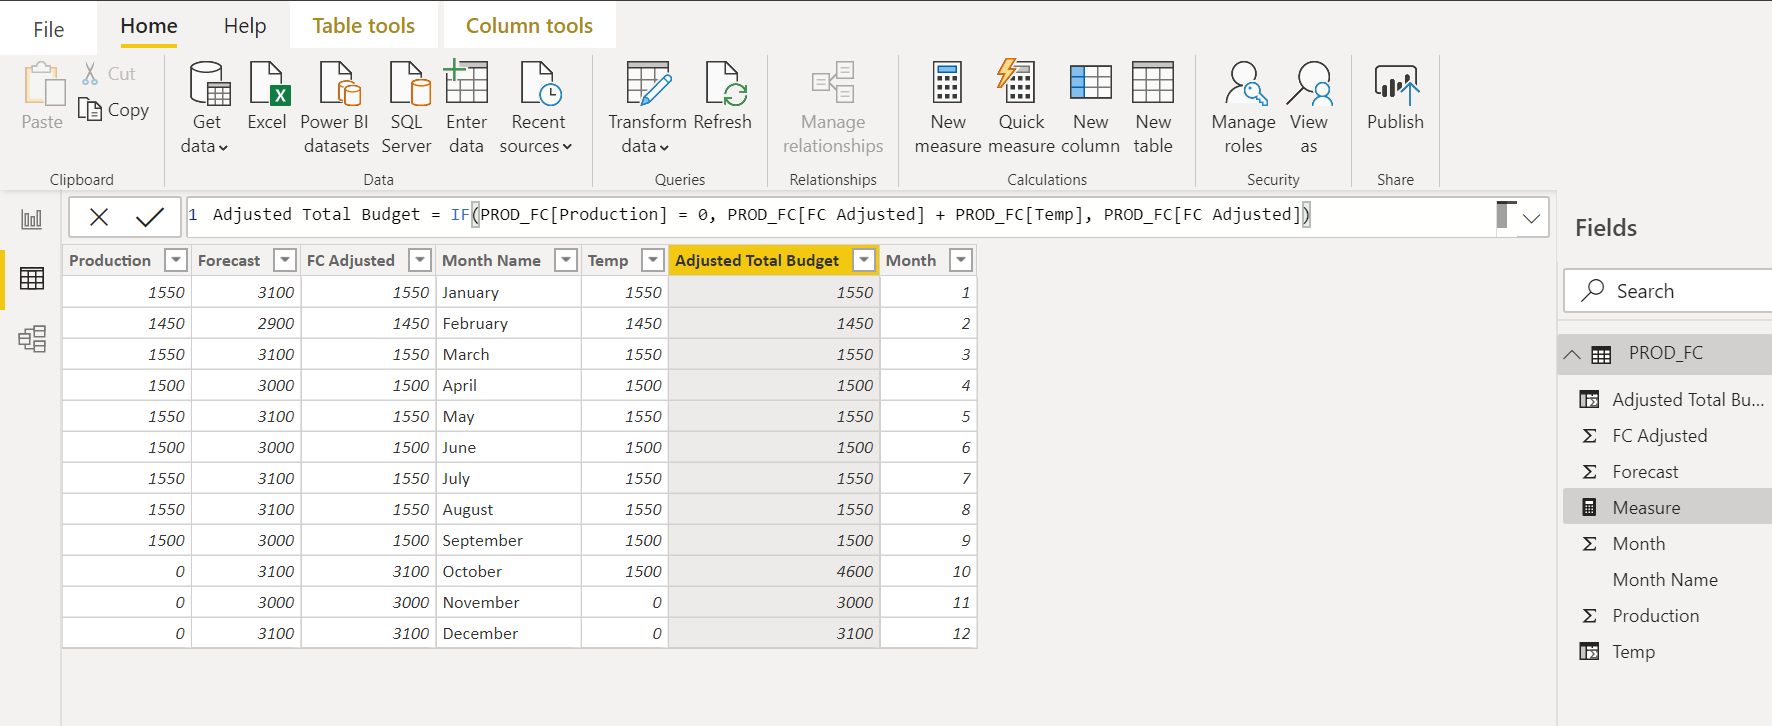
    #"Added Custom2" = Table.AddColumn(#"Added Custom1", "Adjusted Total Budget", each if [Production] = 0 then [FC Adjusted] +[Temp] else [FC Adjusted],Int64.Type),
    #"Removed Columns" = Table.RemoveColumns(#"Added Custom2",{"Index", "Temp"})
in
    #"Removed Columns"

Else please provide sample with the scenario.

Hello MK3010 : I did provide the example where the rebalanced forecast has September a only production.

I have to think DAX has a solution. The figures in your FC Adjusted are the ones that I am wanting to see in DAX.

Thanks,

Bill

Hi @Whitewater100,

As I have understand it from the provided excel file you want to see the Total Production figure up to the last Production date and from that point on show the Total Forecast.

This measure will do just that.

Adj Forecast = 
VAR LastProduction = MAXX( ALL(PRODUCTION), PRODUCTION[Month & Year] )
VAR myMonth = MAXX( FILTER( ALL( Dates ), Dates[Month & Year] = LastProduction ), [MonthnYear] )
VAR vTable =
    ADDCOLUMNS( VALUES( Dates[MonthnYear] ),
        "@Value", SWITCH( TRUE(),
            [MonthnYear] > myMonth, [Total Forecast],
            [Total Production]
        ))
RETURN

SUMX( vTable, [@Value] ) 

I hope this is helpful.

1 Like

Hi Melissa:

YES, prefect! Thank you so much!

Best regards,

Bill

Hi @Whitewater100

You should have a Month columnas shown in the output figure.

You can use Calculated Column to add a Temp column as below.

Temp = IF(PROD_FC[Production]=0,LOOKUPVALUE(PROD_FC[Production],PROD_FC[Month],PROD_FC[Month]-1),PROD_FC[Production])

And then another calculated column and use below formula to get the result.

Adjusted Total Budget= IF(PROD_FC[Production] = 0, PROD_FC[FC Adjusted] + PROD_FC[Temp], PROD_FC[FC Adjusted])

Remember to hide the Temp Column from report view. And adjust a little based on your requirement. You can see at last “April” shows I just wanted to show the month name wrt Month.

image

Hi MK3010:

I have received a solution but I’m always up for learning more ways. I attached the file. Currently, Melissa’s measure is called Adj Forecast. Are you able to demonstrateFC use prod for months avail and then switch to FC - EDNA.pbix (104.6 KB) on this file what you mean with the temp and calculated columns?

Thanks very much!

Bill

Hi @Whitewater100

Here you go…

When you goto “Data” view and click on New Column a calculated column is added and you can enter the mentioned formula (this formula will shift the data of mentioned column by 1 row down). Below 2 for your reference.

Hello:

Thank you, I get the alternative approach.

I appreciate you chipping in here!

Best regards,

Bill

Hi Melissa:

I had a couple of questions I hope you can answer for me. What is the reason for using the second variable “mymonth”? Is it to convert the Month & Year to a numerical value from text?

Also is there any special reason you named the new virtual column “@Value”?

I’m hoping to get a deeper understanding of your thought process.

That was very helpful to me!

Thank you,

Bill

Hi @Whitewater100,

Thanks for your questions.

You could say that, I’ve used it to lookup the MonthnYear interger in the Dates table…
(1) Use MAXX to retrieve a scalar value of any type, in this case text
(2) Get a scalar value from the Dates table MonthnYear attribute which is of type integer
(3) For each row in the vTable use switch/true (can be substituted with if logic) to determine the value based on if the MonthnYear value > myMonth
(4) Sum all values in the vTable visible in the current context

As for the “@” in temporary column names the main reason for that is to make it easy to distinguish them from measures. Below is the full article by SQLBI on this topic.

I hope this is helpful.

1 Like

Hi Melissa:

Yes and thank you for the prompt reply. I’ll read the article too. I believe my final question is, if all three tables had a numeric filed “Year-Month” e.g., 202009 how would your measure look if that was the case?

Would it be one variable to note lastproduction and then just an IF statement?

Thanks again and have a nice day-night?

Bill

Seems I was already asleep LOL
Corrected and clarified my response in the previous post, apologies.

If the LastProduction variable returns an integer of the same structure are the MonthnYear from the Dates table then the myMonth variable can be omitted. You can substitute the SWITCH/TRUE with IF logic to determine the correct [@Value] if that is what you prefer.

I hope this is helpful

Thank you and please get some rest. I appreciate you letting me know the option and I believe you just taught me something very useful.

If you are in New Zealand it must be around 2:00 a.m. WOW!

Thanks again Melissa…

Hi Melissa,

I would like to create a measure to replicate your formula, I have this measure for cumulative totals actuals but I’m not able to tune it to see the forecasted months (for example I need to add to the cumluative Gross Revenue of period 8 , the forecasted months of P9 until P12)

Cumulative GR Actuals =

if(isblank([GR Actuals]),

blank(),

CALCULATE( [GR Actuals], FILTER( ALLSELECTED(‘Date table’), ‘Date table’[Date] <= MAX(‘Date table’[Date]))))

Thanks

Regards

Hi @Rachid,

Welcome to the forum!

Can you please create a new topic for your question, new questions in already solved topics tend to get lost because they are hard to find… Furthermore supply as much additional details as you can, like:

  • a sample PBIX file with the work you have already done
  • a mock up of the desired result

You’ll find that there are a lot of talented members out there that are willing to help and that providing this info will ensure a quick response :wink:

Thank you!

1 Like